
COVID-19 Vaccination Coverage Across Texas Counties
A Bayesian spatiotemporal analysis of first-dose coverage in 254 counties, rebuilt from archived state records, with a reproducible pipeline and an interactive map.
Why it matters
A county comparison is only as good as its records. This study keeps recorded counts, reconstructed counts and model estimates apart, traces each number to a source file, and reports where its models did not predict well.
My contribution
The study rebuilds the county record from 46 archived editions of the state workbook and daily copies of its county sheet. It models first-dose uptake in 238 counties with a Bayesian spatiotemporal model and tests that model on data it had not seen. The project includes a numbered R pipeline, three written reports, a six-page summary PDF and an interactive map site.
Result
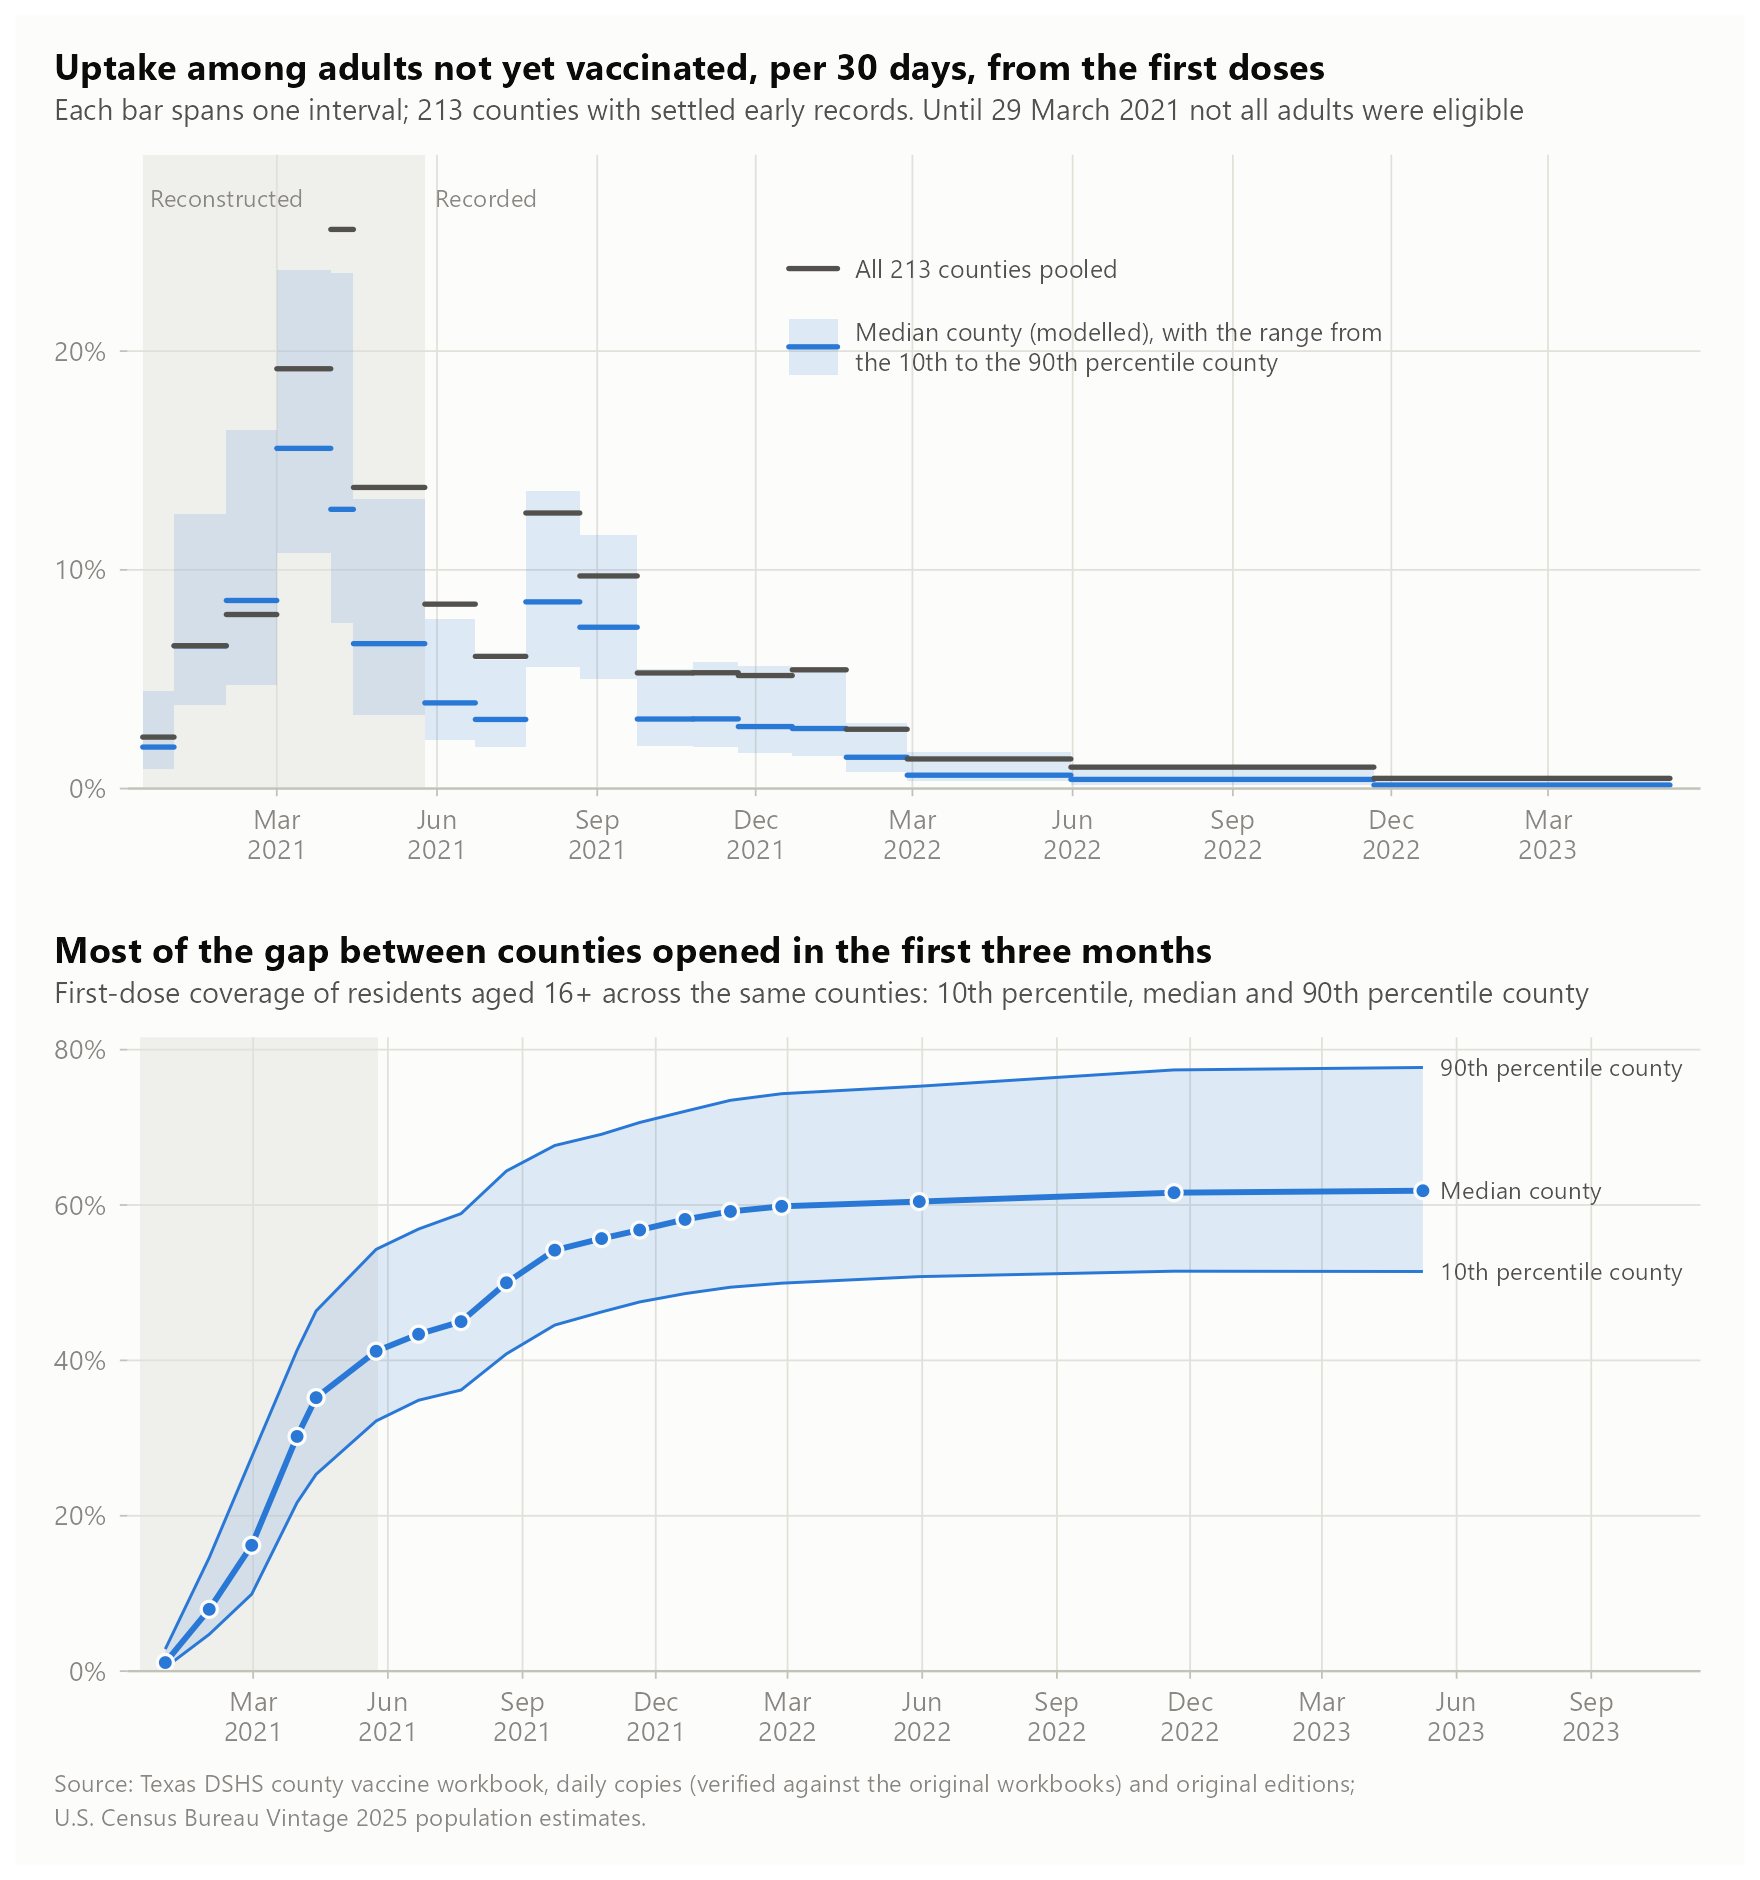
Recorded statewide coverage rose from 52.5% to 82.3% between May 2021 and May 2023, while the gap between the 90th- and 10th-percentile county widened from 21.7 to 26.2 points. Most of that gap opened in the first three months of the rollout. Uptake among adults not yet vaccinated differed about threefold between counties, and counties with more older adults fell behind once all adults became eligible in spring 2021.
Tools
- R
- R-INLA
- data.table
- sf
- ggplot2
- JavaScript
- SVG
- GitHub Actions
- GitHub Pages
Every figure describes vaccination as recorded in the state registry, not willingness to be vaccinated. The findings about age, income and cases are associations between county characteristics and county outcomes. They do not describe individuals, and they do not show why uptake differed. The models leave out 16 counties and 8.8% of adults, including El Paso, Hidalgo, Cameron and Webb. No model forecast the statewide level of the next interval well.
Project gallery
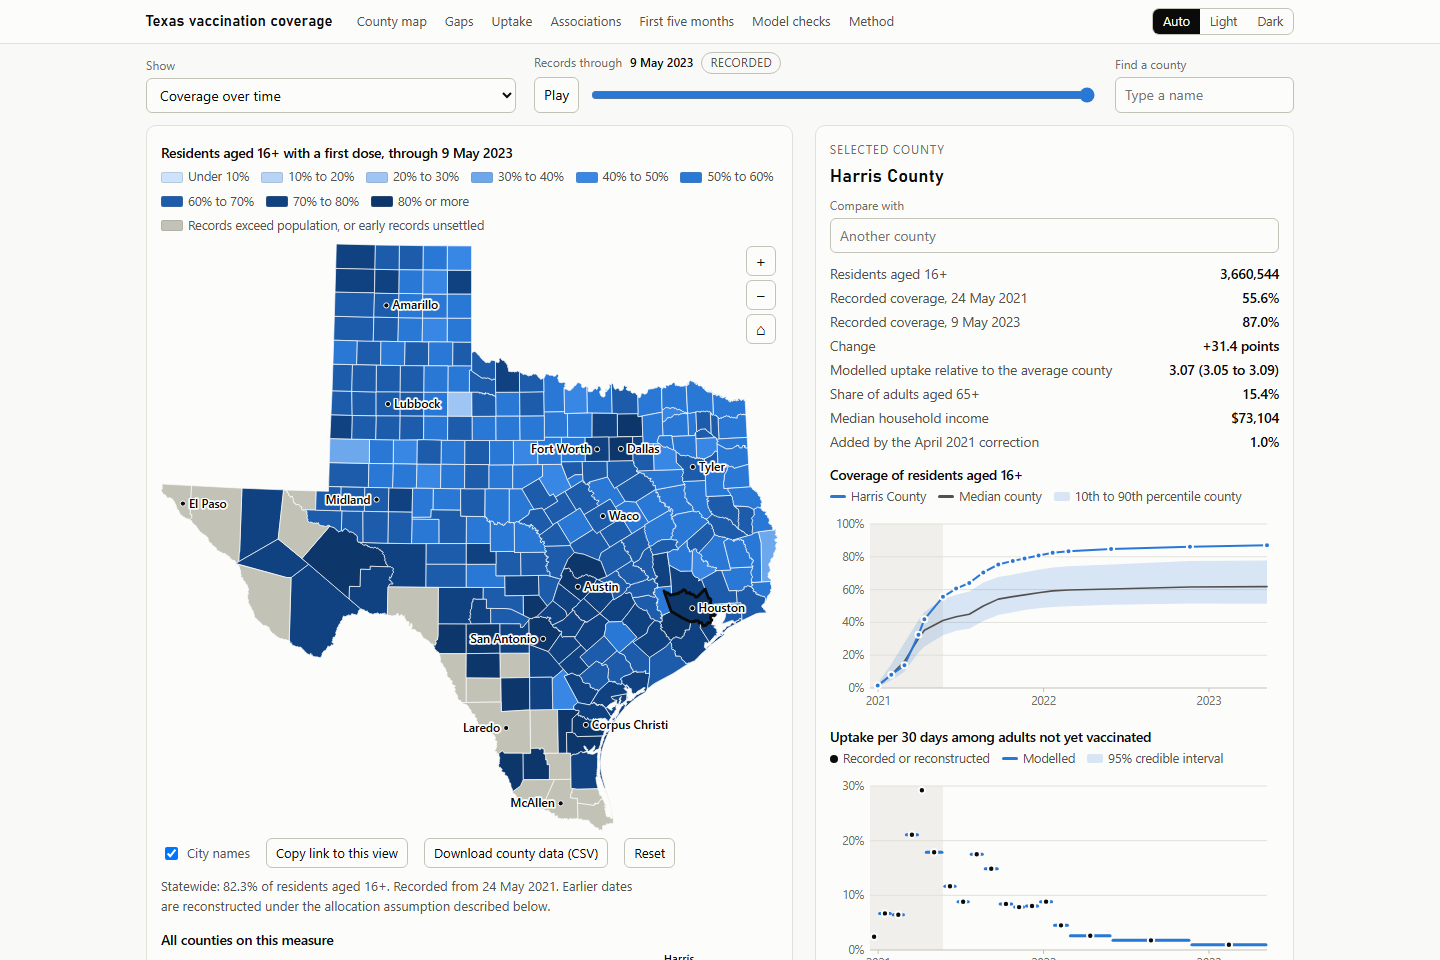
A view of the interactive site and the three figures of the summary report. 4 images. Select an image to view it full size.
What the records show
Three words have a fixed meaning in the study. Recorded is a count from the state registry divided by a Census population estimate. Reconstructed applies before 24 May 2021: the published county count plus the county’s allocated share of the recipients who had no county on record, which rests on a stated assumption. Modelled is a summary from the statistical model, given with a 95% credible interval.
All 254 counties are described and 238 are modelled. Between 24 May 2021 and 9 May 2023 county ranks barely moved (rank correlation 0.90).
- Most of the gap between counties opened in the first three months of the rollout. Across the 213 counties with usable early records, the reconstructed gap was 9.9 points at the end of January 2021, 17.6 at the end of February and 22.1 on 24 May 2021.
- Uptake was fastest in early April 2021, just after eligibility opened to all adults: statewide, 26.5% of adults not yet vaccinated received a first dose per 30 days.
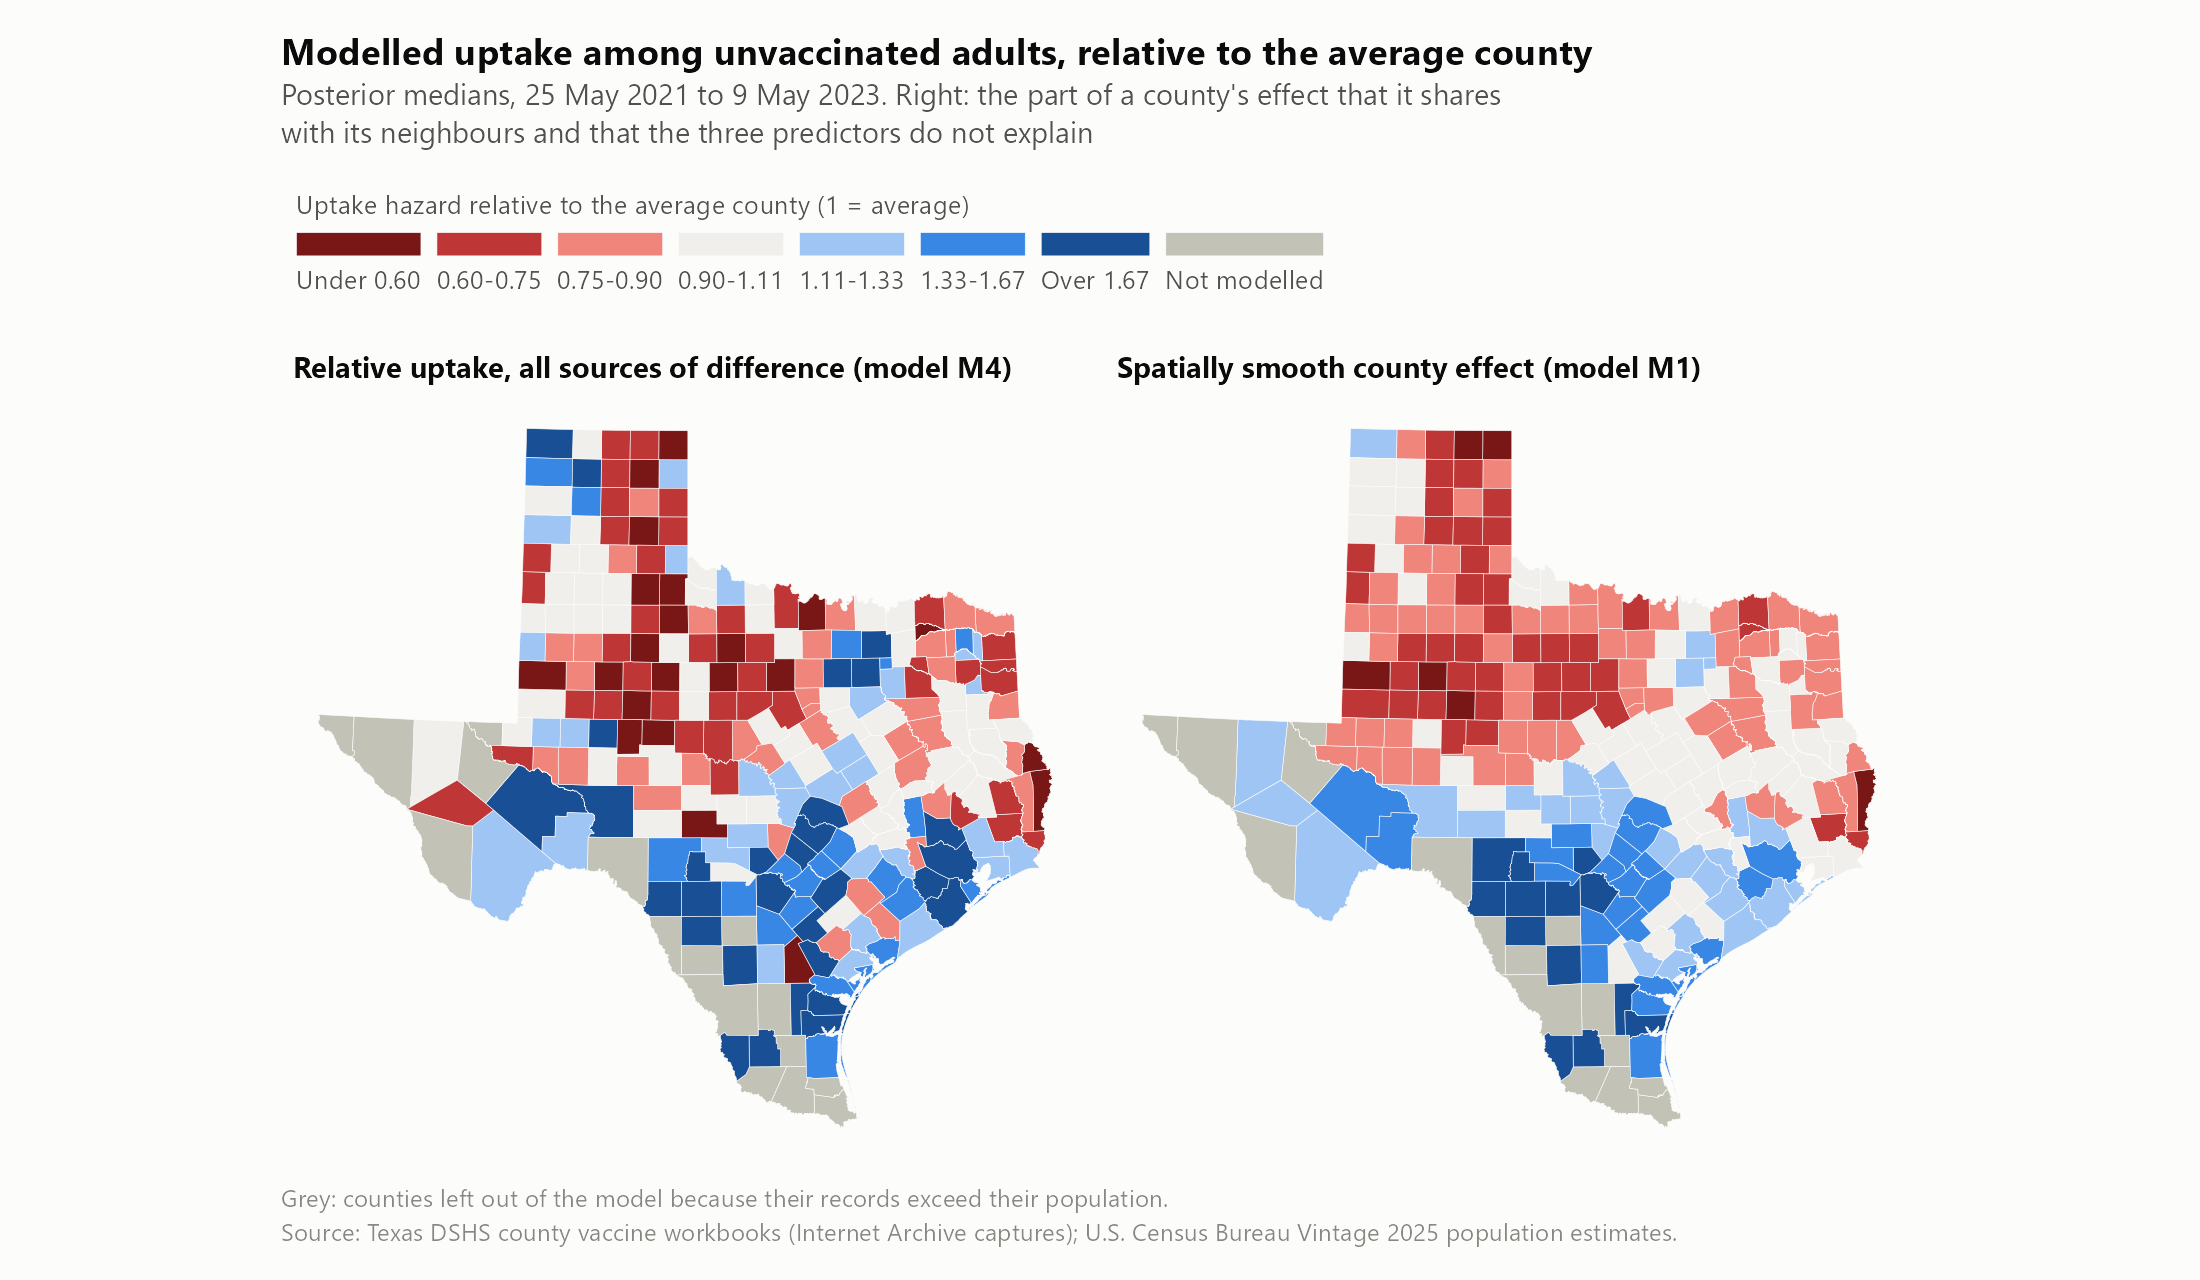
- Between 25 May 2021 and 9 May 2023 the modelled uptake rate in the 90th-percentile county was 3.0 times that in the 10th-percentile county. Rates were lowest in the Panhandle, the Rolling Plains and deep East Texas, and highest in the large metropolitan counties and South Texas.
- Counties that were ahead in May 2021 went on vaccinating their remaining unvaccinated adults faster: 1.49 times faster for each 10 points of starting coverage. That is why the gap kept widening.
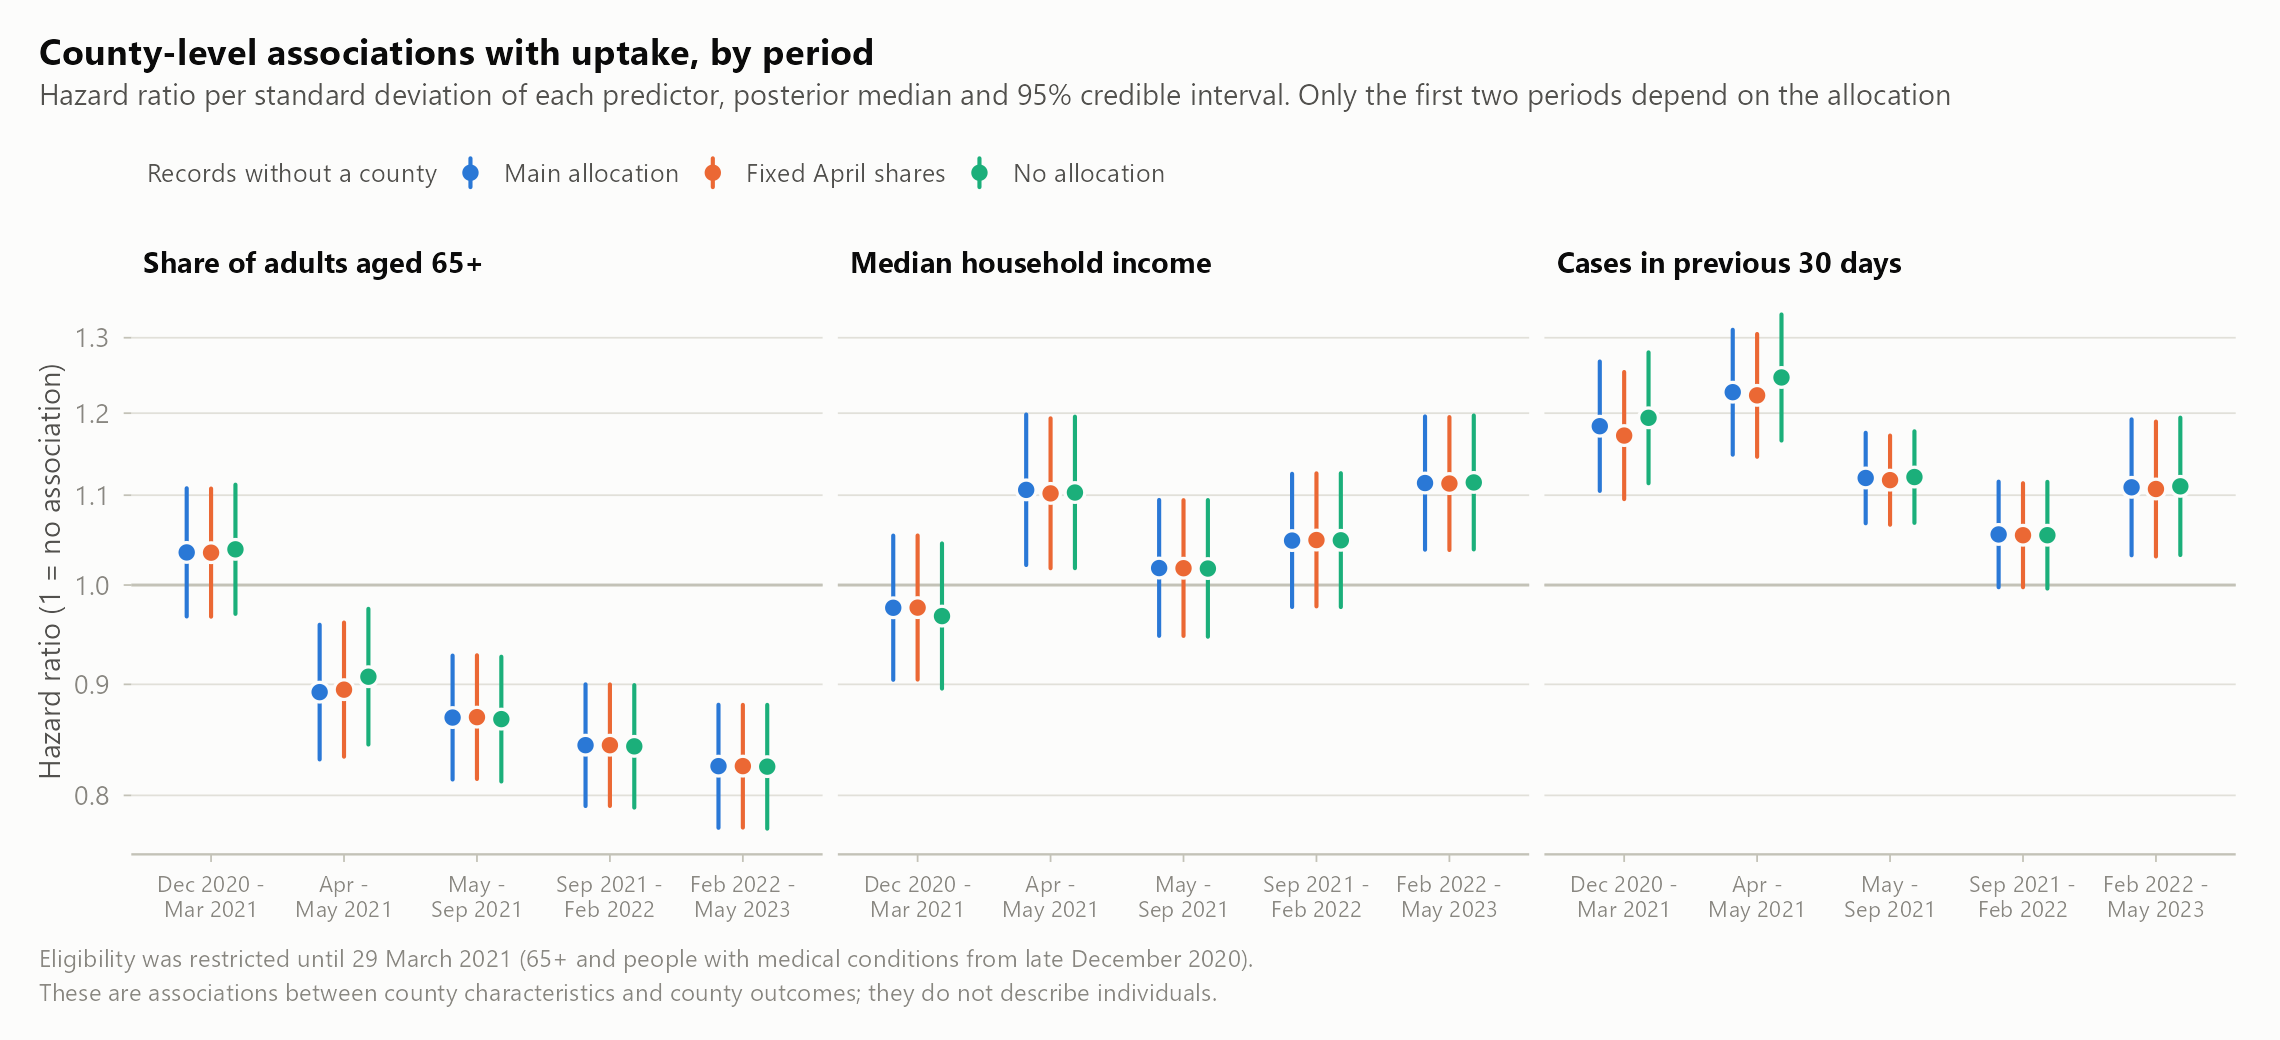
- While eligibility was restricted, counties with a larger share of adults aged 65 and over had similar or slightly higher uptake: the hazard ratio per standard deviation of that share was 1.04 (0.97 to 1.11). In April and May 2021 it was 0.89 (0.83 to 0.96), and over the two years from 25 May 2021 it was 0.83 (0.78 to 0.88).
- Counties with more reported cases in the previous 30 days had higher uptake in every period: the hazard ratio was 1.06 (1.03 to 1.09) after May 2021. Median household income went with later uptake only weakly: its hazard ratio, 1.05 (0.98 to 1.13), is an interval that includes no association.
| Measure | 24 May 2021 | 9 May 2023 |
|---|---|---|
| Statewide (all 254 counties) | 52.5% | 82.3% |
| The 238 modelled counties together | 50.9% | 77.2% |
| Median county among the 238 modelled | 41.3% | 61.9% |
| Gap between the 90th- and 10th-percentile county (points) | 21.7 | 26.2 |
The findings about age, cases and income are associations between county characteristics and county outcomes. They do not describe individuals, and they do not show why uptake differed. Recorded, reconstructed and modelled figures all describe vaccine receipt as recorded. None measures willingness to be vaccinated.
How far the results can be trusted
Each model was refitted with part of the data withheld and scored on what it had not seen. The report states what the checks found, including where the models did poorly.
- Spatial structure lowered the prediction error for counties with no data by 14% when random counties were withheld and by 13% when whole regions were.
- County-specific trajectories lowered the error for a county’s next interval by 8%, but made predictions for counties with no data 8% worse.
- No model forecast the statewide level of the next interval well.
- Across 12 alternative analyses the hazard ratio stays within 0.77 to 0.88 for the 65+ share and 1.03 to 1.08 for recent cases. For income it ranges from 1.00 to 1.10: the data do not settle whether income is associated with later uptake.
- The first five months rest on an assumption. On 15 April 2021 the state assigned about 664,000 previously unassigned recipients to counties in a single edition. The reconstruction assumes each county was missing the same relative share of its recipients at earlier dates. With no allocation at all, the gap between counties differs by at most 0.7 points, but the coverage of individual counties moves by up to 8.5 points.
- The model has three predictors only. Age composition and income go together with rurality, access to health care, political preference and ethnic composition, none of which is in the model.
- R-INLA approximates the posterior. A second approximation gave the same estimates, but no simulation-based (MCMC) fit was run to confirm them.
Technical details
Finished November 2026 · Texas DSHS records, December 2020 to May 2023 · Residents aged 16 and over
Texas published its county vaccination counts in one workbook that it overwrote each day, so the county record of the rollout survives only in archived copies. Until 15 April 2021, 5% to 11% of recipients had no county on record, and in 16 counties the recorded number of vaccinated adults exceeds the adult population. A county comparison has to deal with all three.
- Recover the state’s county workbook from the Internet Archive and from verified daily copies, and record the address and checksum of each of the 365 source files.
- Measure coverage as recorded first doses over the Census estimate of residents aged 16 and over, and uptake as the share of adults not yet vaccinated who received a first dose, per 30 days.
- Analyse 24 May 2021 to 9 May 2023 in 12 intervals between surviving editions, and reconstruct the first five months separately, because early records left some recipients without a county.
- Fit a binomial model with a time effect shared by all counties, a county effect that borrows strength from neighbouring counties (BYM2), a trajectory for each county and three predictors, using R-INLA. Compare five versions.
- Refit each model with part of the data withheld and score it on what it had not seen.
- Fill the reports from the result tables and build the interactive site as one standalone file.
Choices the sources forced
| Choice | What was used | Why |
|---|---|---|
| Age group | Residents aged 16 and over | The state’s county age bands start at 16. The only county counts for ages 18 and over are in a CDC file that has no Texas county data before 22 October 2021 and disagrees with the state’s records. |
| Time unit | Intervals between surviving editions: 26 to 35 days until February 2022, then 94, 174 and 170 days. Uptake is reported per 30 days. | The state overwrote one workbook each day. Editions survive only on the dates the Internet Archive captured them. |
| Study period | Main analysis from 24 May 2021; the first five months reconstructed separately | Until 15 April 2021, 5% to 11% of recipients had no county on record, by a different amount in each county. |
| Counties | 238 modelled; 16 shown but not modelled | In those 16 the recorded number of vaccinated adults exceeds the adult population, so the records cannot be read as coverage of residents. Most are along the Mexican border. |
Model
A binomial model for first doses among adults not yet vaccinated, with a time effect shared by all counties, a county effect that borrows strength from neighbouring counties (BYM2), a trajectory of its own for each county, and three predictors: the share of adults aged 65+, median household income, and cases reported in the previous 30 days. It was fitted with R-INLA, and five versions of the model were compared.
Pipeline and site
- The R scripts are numbered in the order they run. The 365 source files are kept as downloaded, each with its address, retrieval time, size and SHA-256 checksum in a manifest.
- After the downloads, no step needs a network. Posterior draws use a fixed seed, and package versions are recorded.
- An audit script re-derives county numbers from raw cells and checks the checksums.
- The interactive site is one self-contained HTML file of about 400 KB with no dependencies. It holds its own data and county outlines and loads nothing from the network.
- The site has a county map through time, county comparison, a scatter explorer, light and dark themes, and touch support.
- GitHub Actions publishes the site and the reports to GitHub Pages exactly as committed. Nothing is built there.
Stack
R with R-INLA, data.table, sf and ggplot2 for the analysis and figures; plain JavaScript and SVG for the site; GitHub Actions and GitHub Pages for publication.