
Land Change Atlas
A Python pipeline that maps land cover change year by year at three sites from open satellite imagery, with an interactive map report of the results.
Why it matters
A change map is easy to draw and hard to trust. This project measures change with one pipeline at three sites, checks its results against independent maps, and reports what it found wrong in the source data.
My contribution
I built one Python pipeline for all three sites. Each run searches public STAC catalogues, builds a cloud-free composite per year as a lazy xarray cube, classifies it, measures what changed, and publishes its outputs as Cloud Optimized GeoTIFFs described by their own STAC catalogue. I also built the interactive map report of the results.
Result
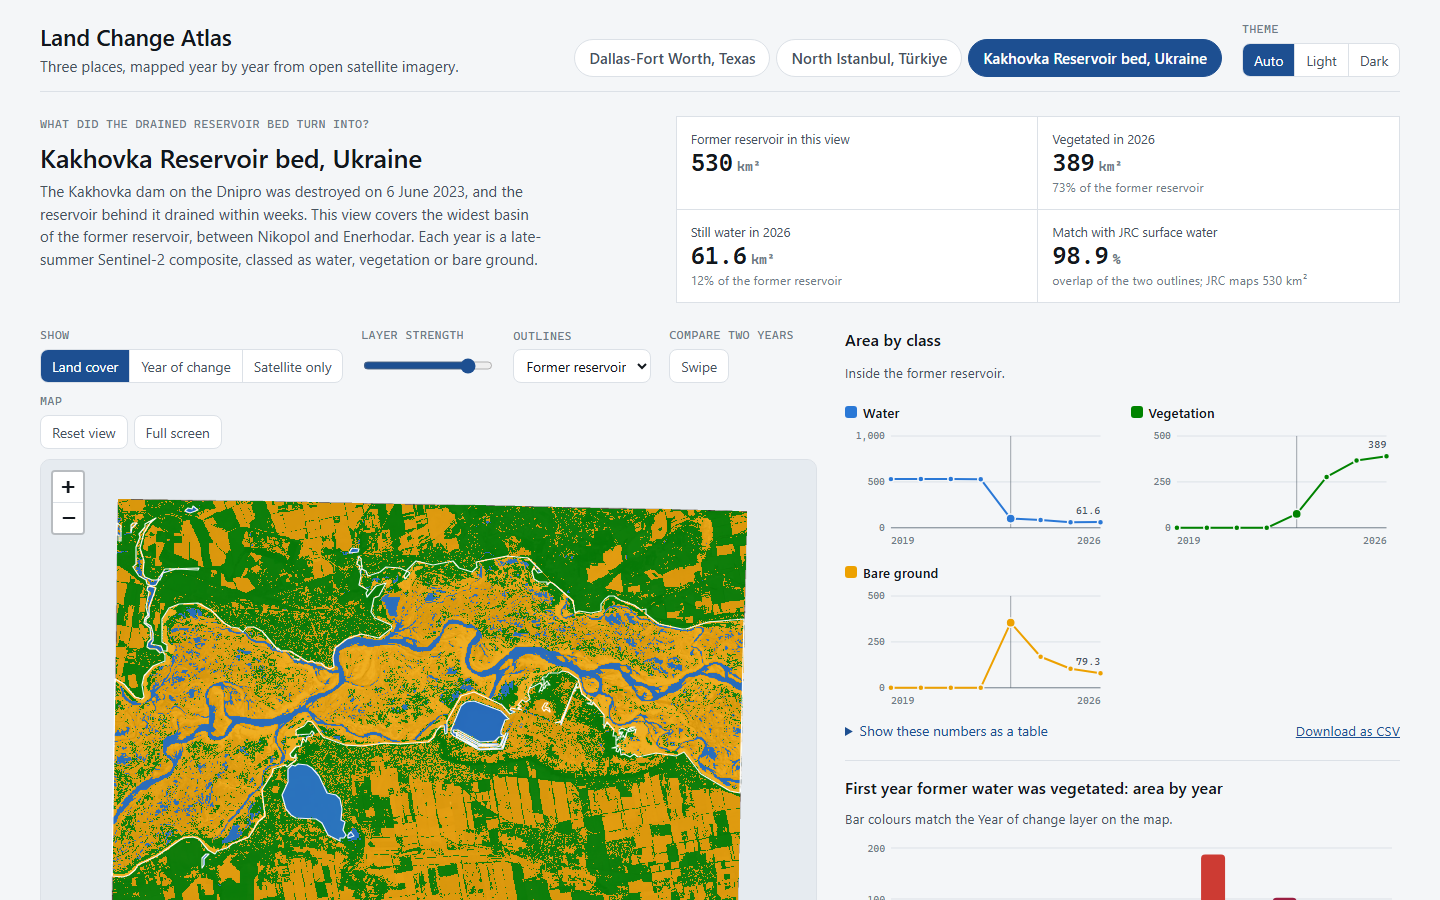
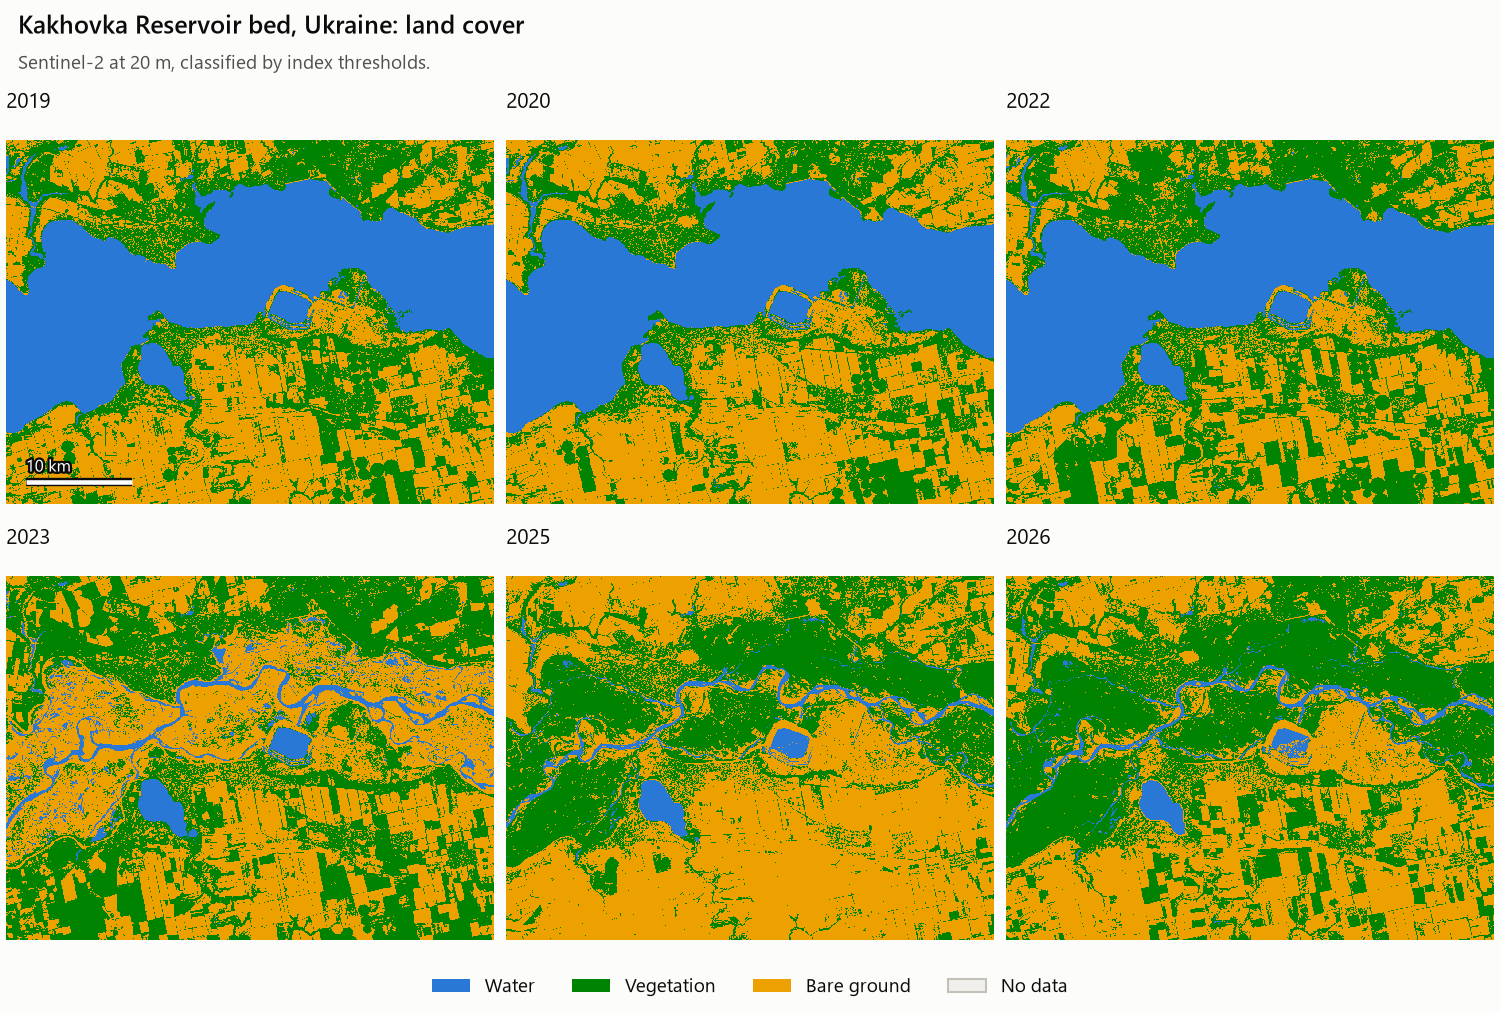
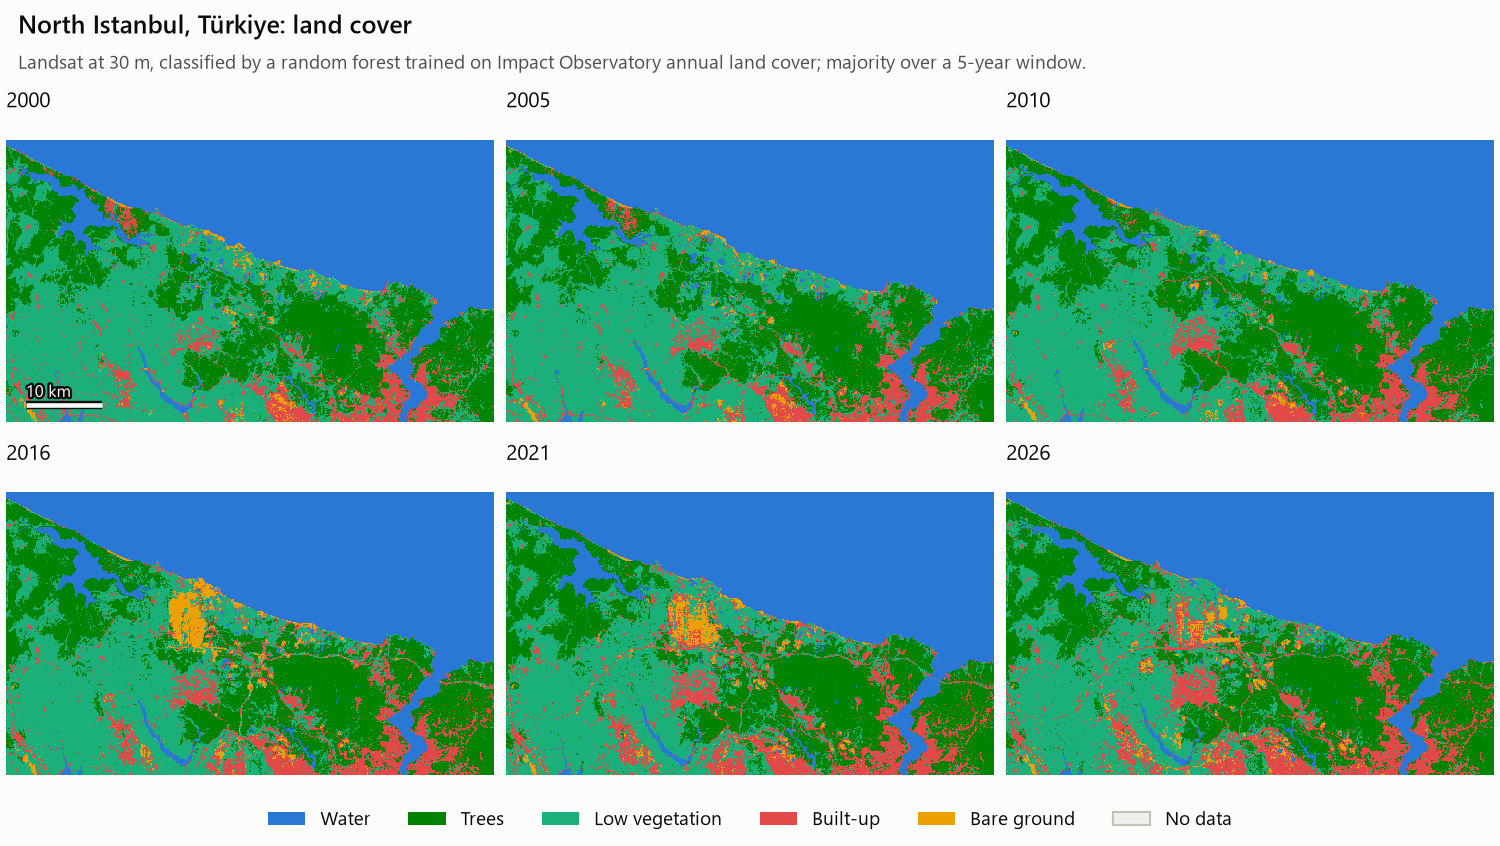
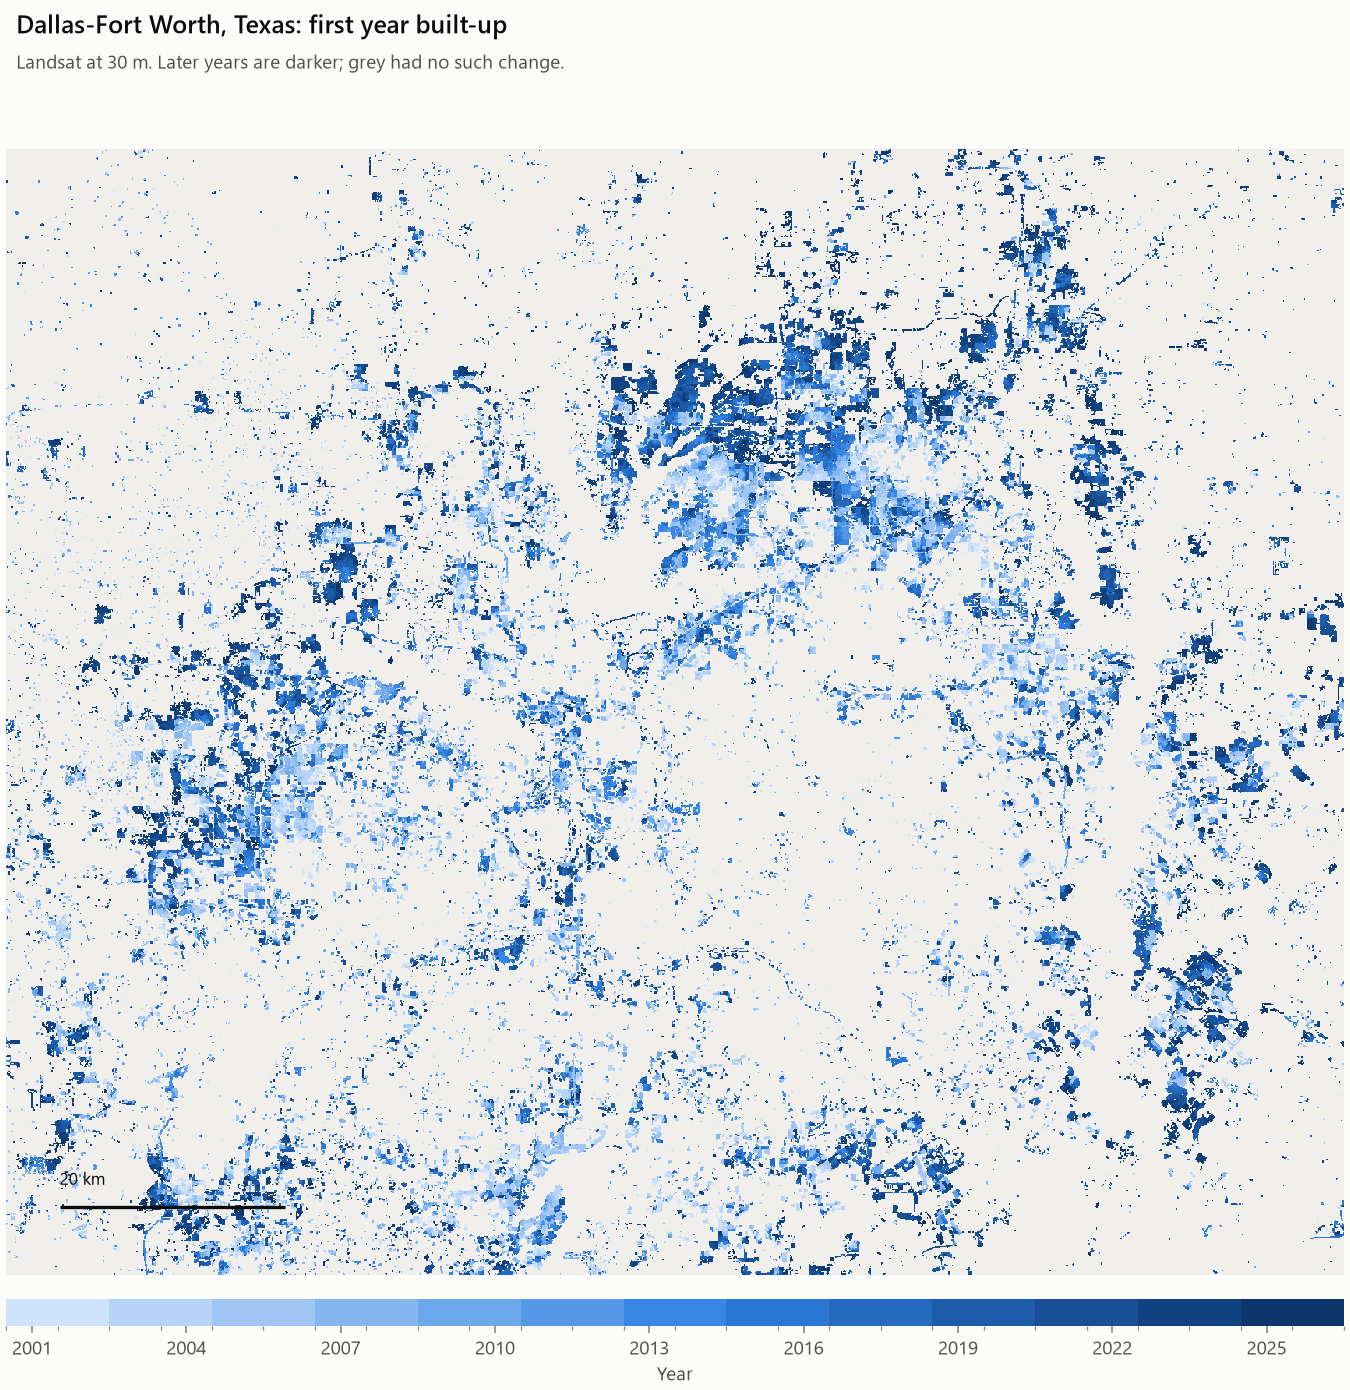
At the Kakhovka Reservoir bed, 530 km² of open water before the dam was destroyed in June 2023 fell to 100 km² that summer, and by 2026 73% of the former bed was vegetated. North of Istanbul, the site of the new airport was stable from 2000 to 2013; then tree cover there fell from 47 to 17 km² by 2018. In Dallas-Fort Worth, built-up land grew from 3,631 to 5,007 km² between 2000 and 2026, with 1,161 km² new and lasting.
Tools
- Python
- STAC
- xarray
- dask
- rasterio / GDAL
- GeoPandas
- scikit-learn
- Leaflet
- pytest
The classifier scores of 82 to 94% measure agreement with other land cover products on held-out areas. Those products have errors of their own and define built-up land differently, so the trends are more trustworthy than the levels. Yearly totals are noisy; change over a decade or more and land that stayed in its new class are the figures to read. This is a personal project built on open imagery.
Project gallery
A view of the interactive report and three figures drawn by the pipeline. 4 images. Select an image to view it full size.
Contains modified Copernicus Sentinel data; Landsat courtesy of the U.S. Geological Survey. Source information: Sentinel-2 L2A on Earth Search (opens in a new tab or window), Landsat Collection 2 on Planetary Computer (opens in a new tab or window). Maps and charts are this project’s own classification of that imagery.
What changed at each site
The pipeline covers 3 sites with 5 imagery series and 80 annual composites from 2000 to 2026. The largest grid is about 119 million pixels at 10 m.
Three results are checked against independent sources. The Kakhovka reservoir outline matches the JRC Global Surface Water map with an intersection over union of 98.9%. For Dallas-Fort Worth, the maps gain 1,044 km² of built-up land over 2000 to 2021 against 975 km² in USGS LCMAP, and the independent 10 m series gives the same gain for 2018 to 2026 as Landsat: 475 km² in each.
In Dallas-Fort Worth, the record of when land was built on follows the region’s housing history: 55 to 71 km² a year in the boom of 2002 to 2007, 13 to 19 km² a year in 2010 to 2012 after the financial crisis, and a climb to 77 km² in 2024.
Yearly totals are noisy, so the figures here are change over a decade or more and land that stayed in its new class. Istanbul’s maps before 2013 have no reference map of their own time: read them for what the place looked like, not for changes of a few percent.
| Site | Imagery | What the maps show |
|---|---|---|
| Kakhovka Reservoir bed, Ukraine | Sentinel-2 at 20 m, 2019 to 2026 | 530 km² of open water before the dam was destroyed in June 2023 and 100 km² left that summer. By 2026, 73% of the former bed is vegetated (389 km²). |
| North Istanbul, Türkiye | Landsat at 30 m from 2000; Sentinel-2 at 10 m from 2018 | The site of the new airport was stable for thirteen years, with 5 to 7 km² of built-up and bare land from 2000 to 2013. Then tree cover there fell from 47 to 17 km² by 2018 while built-up and bare land rose to 52 km². Across the whole site, 14 km² was developed for good in 2001 to 2012 and 78 km² in 2013 to 2025. |
| Dallas-Fort Worth, Texas | Landsat at 30 m from 2000; Sentinel-2 at 10 m from 2018 | Built-up land grew from 3,631 to 5,007 km² between 2000 and 2026, up 38%, with 1,161 km² new and lasting. Tarrant County gained most (373 km²), then Denton (347), Collin (339) and Dallas (209). |
What checking the data turned up
Each of these was found by looking at the data, and the pipeline handles each case.
- The older Sentinel-2 collection on Earth Search carries wrong reflectance-offset metadata. This was confirmed pixel for pixel on 20 scenes, and the pipeline now decides from the pixels.
- Earth Search holds duplicate versions of the same acquisition: 104 of the 160 scenes found for one summer. The pipeline keeps one per acquisition.
- Landsat 7 and Landsat 8 do not read the same ground alike: over Dallas, Landsat 7 reads NDVI 0.04 to 0.07 lower in every one of five years both satellites saw. A per-band adjustment fitted on those years puts the two on one scale. With it, the Landsat 7 maps have 0.4% more built-up land than the Landsat 8 maps of the same years on average, and 2 to 4% less in the two years held out of the fitting.
- Open sea bends such a cross-sensor fit, because the two generations disagree most over water. Half the Istanbul scene is sea, so the fit uses land only.
- The Dallas maps step up by about 190 km² at 2013, the year the series changes satellite, and an earlier version of this pipeline blamed that change. Tested directly, the satellites do not explain it, and the step is still there. Half of it comes from the 2013 map itself, from a short first season with few clear looks; the rest is a rise over 2010 to 2016 that the project could not pin on a cause.
- Scenes are chosen per tile and month so years stay comparable, unreadable files are skipped and reported, and 53 tests run without a network.
Technical details
Independent project · Completed November 2026 · Sentinel-2 and Landsat 5 to 9
Land cover maps made year by year are comparable only if every year is built the same way. Open imagery archives hold duplicate scenes, wrong metadata, broken files and two generations of Landsat that read the same ground differently, and each of these can look like change on the ground.
- Search Earth Search and Planetary Computer, drop duplicate versions of the same acquisition, and choose scenes per tile and month so every year samples the season the same way.
- Build each year’s composite as a lazy xarray cube on one fixed grid, mask cloud per pixel, and reduce it to a seasonal median.
- Put Landsat 5 and 7 on the Landsat 8 scale with a per-band adjustment fitted in years both generations saw, and test it on years held out of the fitting.
- Classify with two index thresholds at Kakhovka, and with random forests trained on existing land cover products at Istanbul and Dallas.
- Count a change only if it lasted: the new class must hold for at least two years and reach the last year.
- Publish the outputs as Cloud Optimized GeoTIFFs with their own STAC catalogue, and build the standalone report from them.
Pipeline stages
| Stage | Tools | What happens |
|---|---|---|
| Search | pystac-client, geopandas | Queries the STAC API, drops duplicate versions of the same acquisition, and keeps the best few scenes per tile and month by site coverage and cloud. |
| Composite | odc-stac, dask, xarray | Builds a lazy cube straight from remote Cloud Optimized GeoTIFFs on one fixed grid, masks cloud per pixel, converts to reflectance, and reduces to a seasonal median. |
| Classify | scikit-learn, rasterio (GDAL warped VRT) | Either two index thresholds, or a random forest trained on an existing land cover product that is warped onto the same grid. Where a series spans two generations of Landsat, a per-band adjustment fitted in years both saw puts them on one scale first. |
| Change | numpy, rasterio, geopandas | Fills cloud gaps from neighbouring years, then writes area per class and year, a transition matrix, the year each lasting change began, and areas per zone. |
| Publish | pystac, rio-stac | Writes a self-contained STAC catalogue of the outputs and validates it. |
| Report | rasterio (GDAL warp), Pillow, Leaflet | Warps every layer to Web Mercator, writes small web images and one data file, and assembles the standalone report. |
Reading the results
- The random forest scores are agreement with the reference product on blocks of pixels held out from training: 92% and 89% for the two Istanbul series, 94% for Dallas at 30 m, and 82% for Dallas at 10 m.
- Reference products disagree on definitions: “developed” in USGS LCMAP includes suburban lawns, and “built area” in the Impact Observatory maps is drawn broadly.
- Yearly totals are noisy; lasting change is steadier. The year-of-change map counts only land that stays in its new class to the last year, which is why it is the product to trust across the 2013 change of satellite.
- A net gain hides flows in both directions. In the Dallas Landsat series, 413 km² left the built-up class and 1,788 km² entered it between 2000 and 2026; much of the outflow is most likely the classifier changing its mind about mixed pixels.
- Istanbul before 2013 has no reference of its own time: those maps come from a forest whose only labelled Landsat 7 pixels are from 2017 to 2021.
Stack
Python 3.12, pystac-client, odc-stac, xarray, dask, rasterio and GDAL (Cloud Optimized GeoTIFFs, warped VRTs), rioxarray, geopandas, pyogrio, scikit-learn (random forest), pystac, rio-stac, click, uv, pytest and ruff. The report is a standalone static app built on Leaflet and hosted on GitHub Pages.