
Building Footprints Comparison: SAM 3 vs ESRI
Extracted building outlines across Lewisville, Texas, from 10 cm Nearmap imagery with Meta’s SAM 3 and ESRI’s pretrained Mask R-CNN, then compared them with identical cleanup and scoring, a tuning protocol written in advance, and a test area scored once.
Why it matters
A comparable evaluation reveals where extraction methods agree, disagree, or miss structures. Those differences can guide building-inventory review, while the older reference outlines limit what the scores establish about present-day accuracy.
My contribution
I built the nbf toolkit and compared my city-wide SAM 3 and local ESRI runs with the city’s published ESRI run. Shared cleanup and scoring made outputs comparable; separate tuning and test areas limited reuse of evaluation data. I did not train or fine-tune either model. Scores measure agreement with 2015 outlines, not accuracy.
Result: On main buildings of 20 m² and up, ESRI’s city run agrees best with the city’s 2015 outlines: city-wide F1 0.83 vs 0.74 for SAM 3. Scored once on the test area, F1 is 0.95 for ESRI’s city run, 0.91 for ESRI’s local run, and 0.87 for SAM 3. SAM 3 processed the whole city in 2 h 41 min on a 6 GB laptop GPU (RTX 4050).
Tools
- Python 3.12, 3.13 and 3.14 (CPU)
- PyTorch 2.10 with CUDA 12.8
- SAM 3 through SamGeo 1.4.2
- ArcGIS Pro 3.7 and ArcPy (Image Analyst)
- rasterio and GDAL
- GeoPandas, Shapely 2, pyproj
- SciPy
- WSL2
- pytest, coverage, ruff
- GitHub Actions
- Jupyter
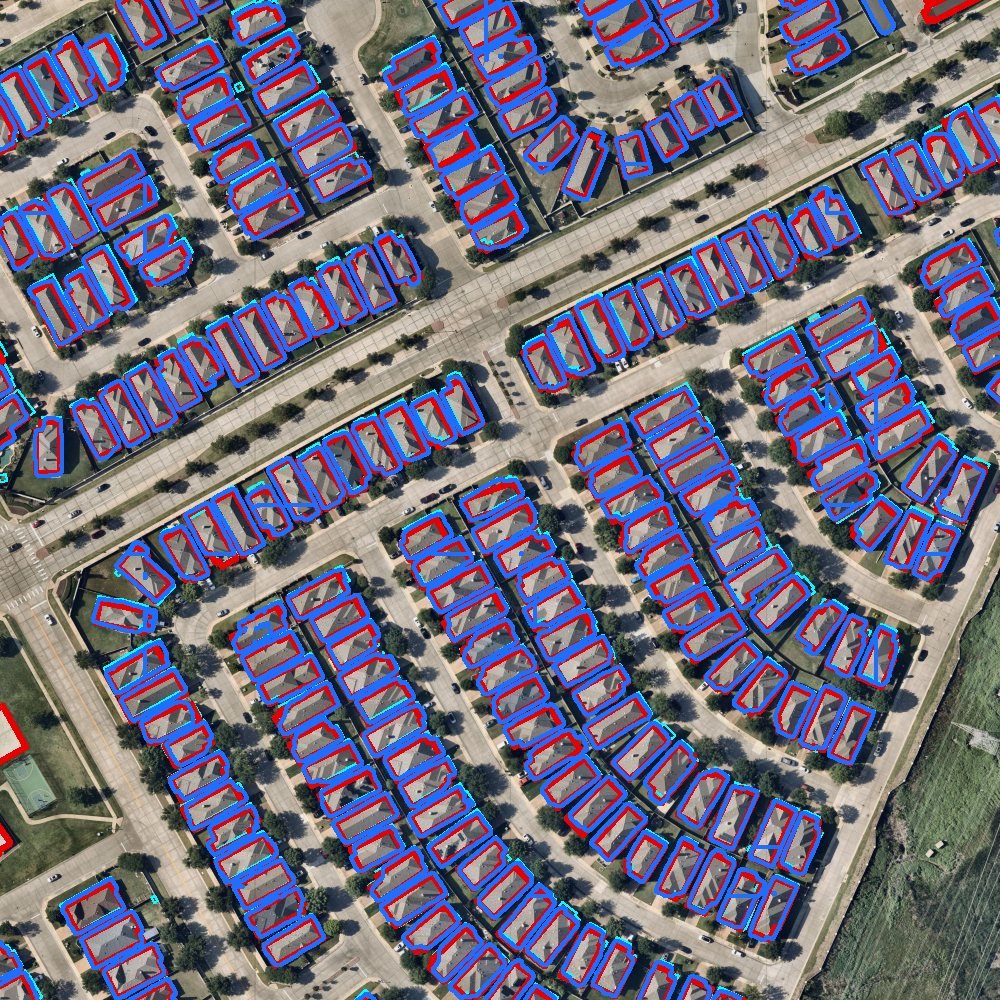
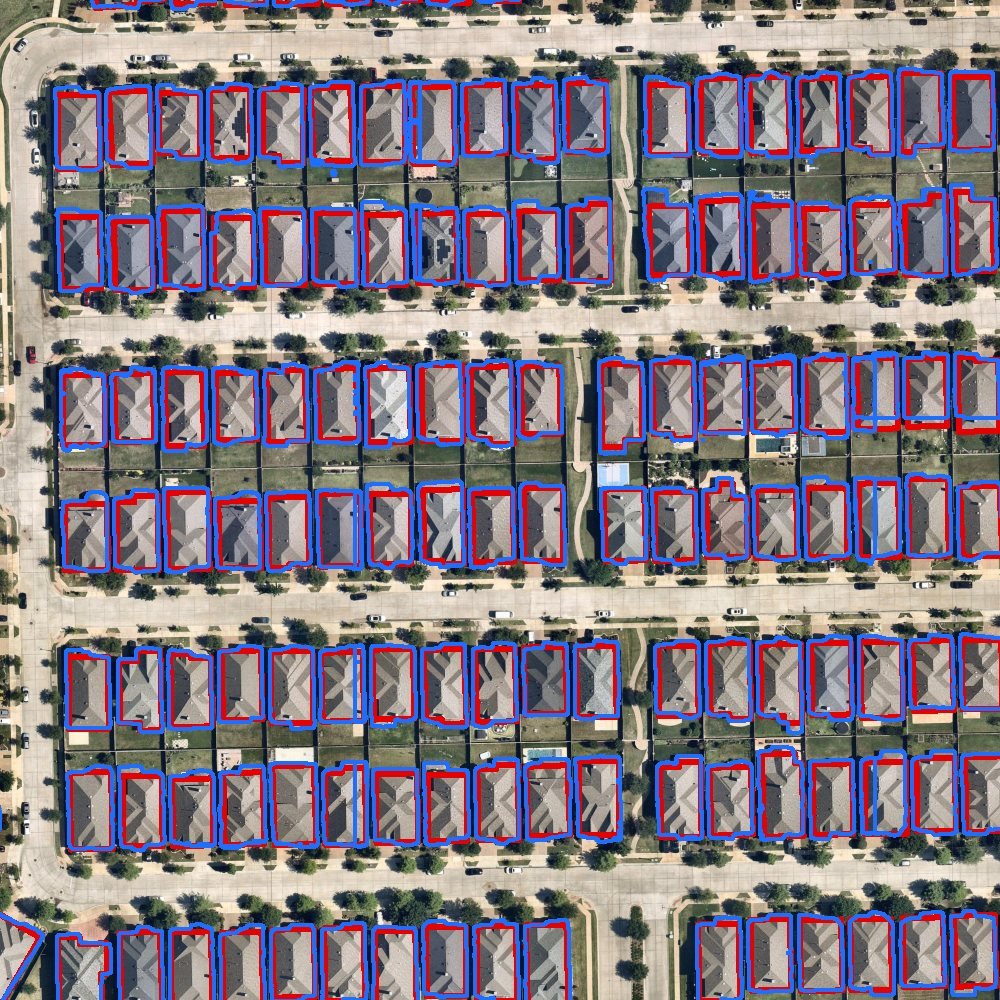
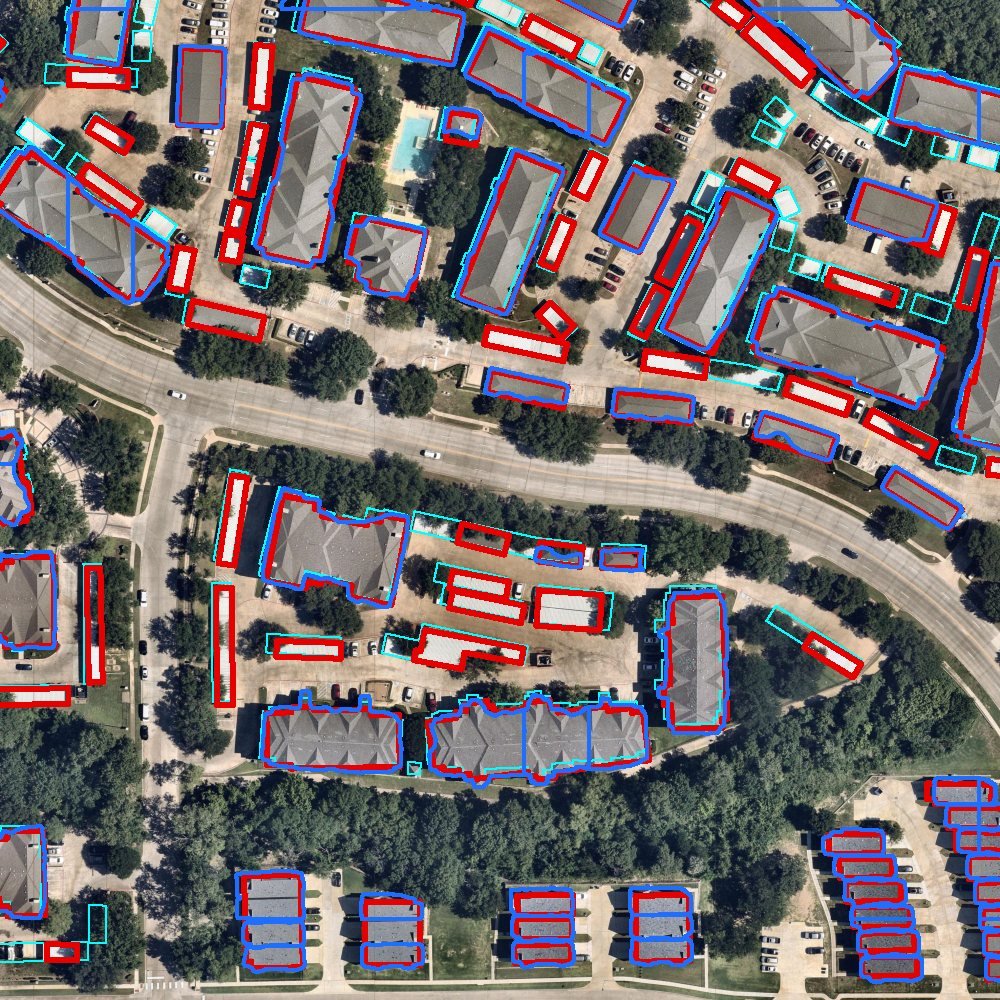
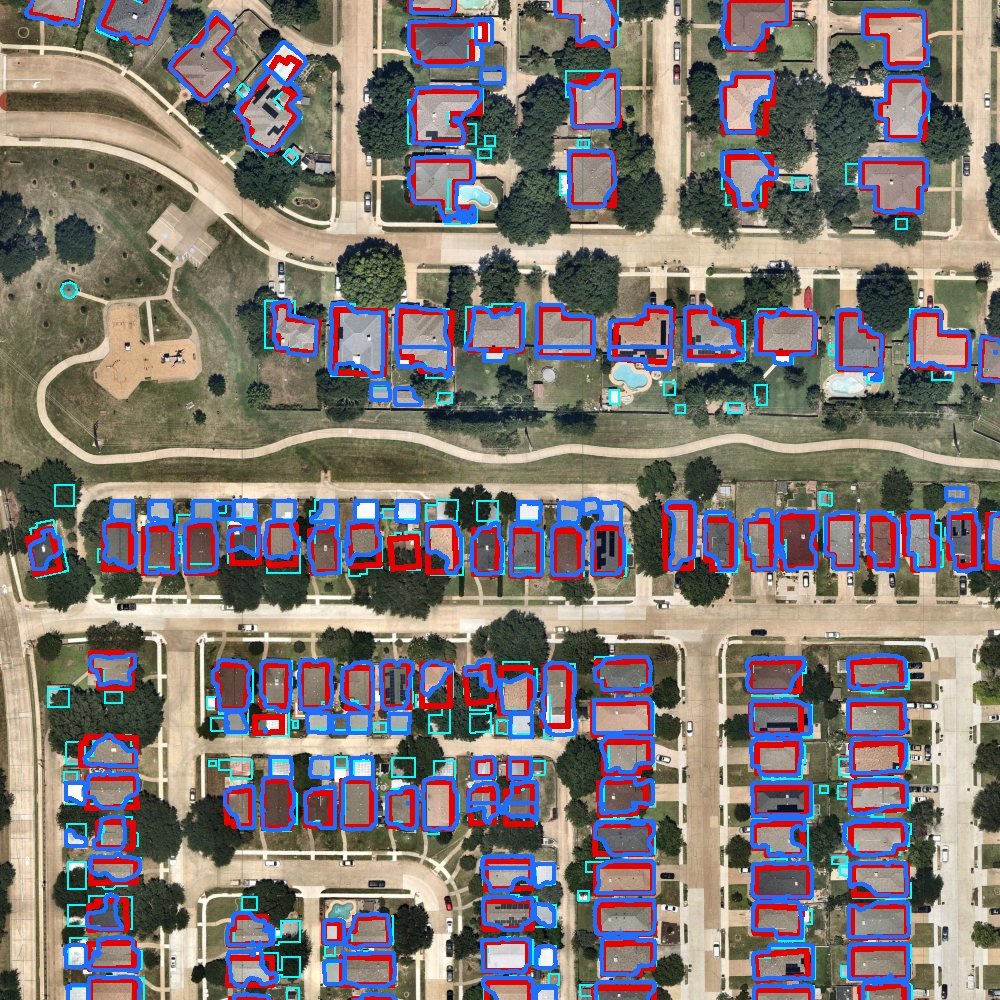
Agreement, not accuracy: every score is measured against the city’s 2015 building outlines, which are years older than the imagery. Neither model finds most sheds under 20 m², and both split very large buildings at processing boundaries.
Project gallery
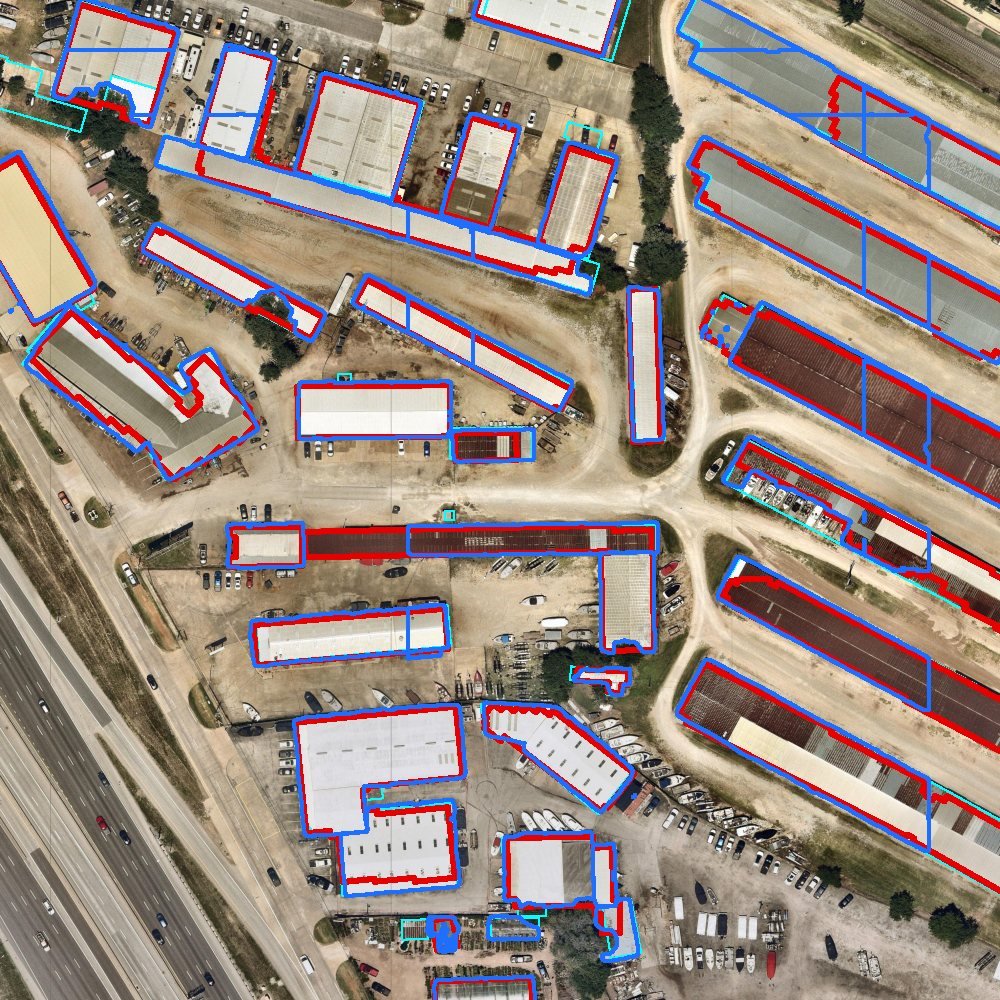
Aerial imagery: Nearmap, May 2026. Red is ESRI, blue is SAM 3, thin cyan is the city’s 2015 outlines. 5 images. Select an image to view it full size.
Approach
I prepared 6,538 overlapping imagery tiles and ran SAM 3 and ESRI’s pretrained model over the same area. Shared cleanup and one-to-one scoring made the outputs comparable. I selected settings in one area, froze them, then evaluated a separate test area once. Because the reference outlines date from 2015, the scores describe agreement with that inventory, not current extraction accuracy.

Results
| Measure | ESRI, city run | ESRI, local raw run | SAM 3 |
|---|---|---|---|
| City-wide F1 | 0.83 | 0.77 | 0.74 |
| City-wide precision / recall | 0.82 / 0.85 | 0.70 / 0.84 | 0.68 / 0.82 |
| Test-area F1, scored once | 0.95 | 0.91 | 0.87 |
| Structures under 20 m² found, of 7,867 | 2 | 352 | 267 |
| Recorded run time, whole city | published by the city | 8 h 46 min model time | 2 h 41 min |
What the scores say
- ESRI’s published run agrees best with the 2015 outlines, mostly on precision. Its own post-processing matters: the same model run locally without it scores 0.77.
- The two models mostly agree: 91% of ESRI’s outlines have a matching SAM 3 outline, and matched outlines from SAM 3 fit slightly more tightly (median IoU 0.80 against 0.77).
- Candidates for inventory review: 4,923 SAM 3 outlines with no 2015 counterpart are also drawn by ESRI. Agreement between the models suggests new or changed buildings, but does not establish that each outline is correct.
- Both models miss most sheds under 20 m² and split very large buildings at processing boundaries.
Found by both, one model, or neither

Engineering, validation, and earlier work
I built a resumable Python pipeline for imagery preparation, model runs, shared scoring and review, with input checks and recovery for interrupted processing. The October 1 validation passed 205 CPU tests on each of six Windows/Linux configurations and 56 tests in a separate PyTorch job. New comparison, review and seam-merging commands were tested on synthetic data, not rerun on the Lewisville imagery, so they do not change the reported scores.
Neither model was trained or fine-tuned here; scores measure agreement with older 2015 outlines, not extraction accuracy. Earlier work recovered all 120,426 expected tiles from an October 2025 imagery collection and assembled a mosaic for building and road extraction; that coverage check is separate from the May 2026 comparison and does not validate extraction accuracy.
Technical details
Professional · Geospatial Software Developer / Data Scientist · Nearmap imagery, May 2026
Cities keep building inventories for permits, taxes and planning, and they go stale: Lewisville’s outlines date from 2015 or earlier. New aerial imagery arrives every year. The question was how a general-purpose foundation model compares with a purpose-built vendor model on the same imagery, and how to make that comparison fair and honest when the only reference outlines are years older than the imagery.
- Fix the imagery’s coordinate system through a VRT, then cut it into 6,538 tiles of 1,536 px with a hash-checked manifest.
- Run SAM 3, prompted with the word “building”, and ESRI’s Mask R-CNN over the same imagery.
- Put both outputs through the same cleanup and scoring.
- Tune and freeze settings on one area, then score a randomly chosen test area once.