
School-zone sign evidence explorer
A Python and Leaflet workflow that reconciles historical street-level sign detections with school-zone GIS data, producing traceable maps, reports, and field-review priorities.
Project gallery
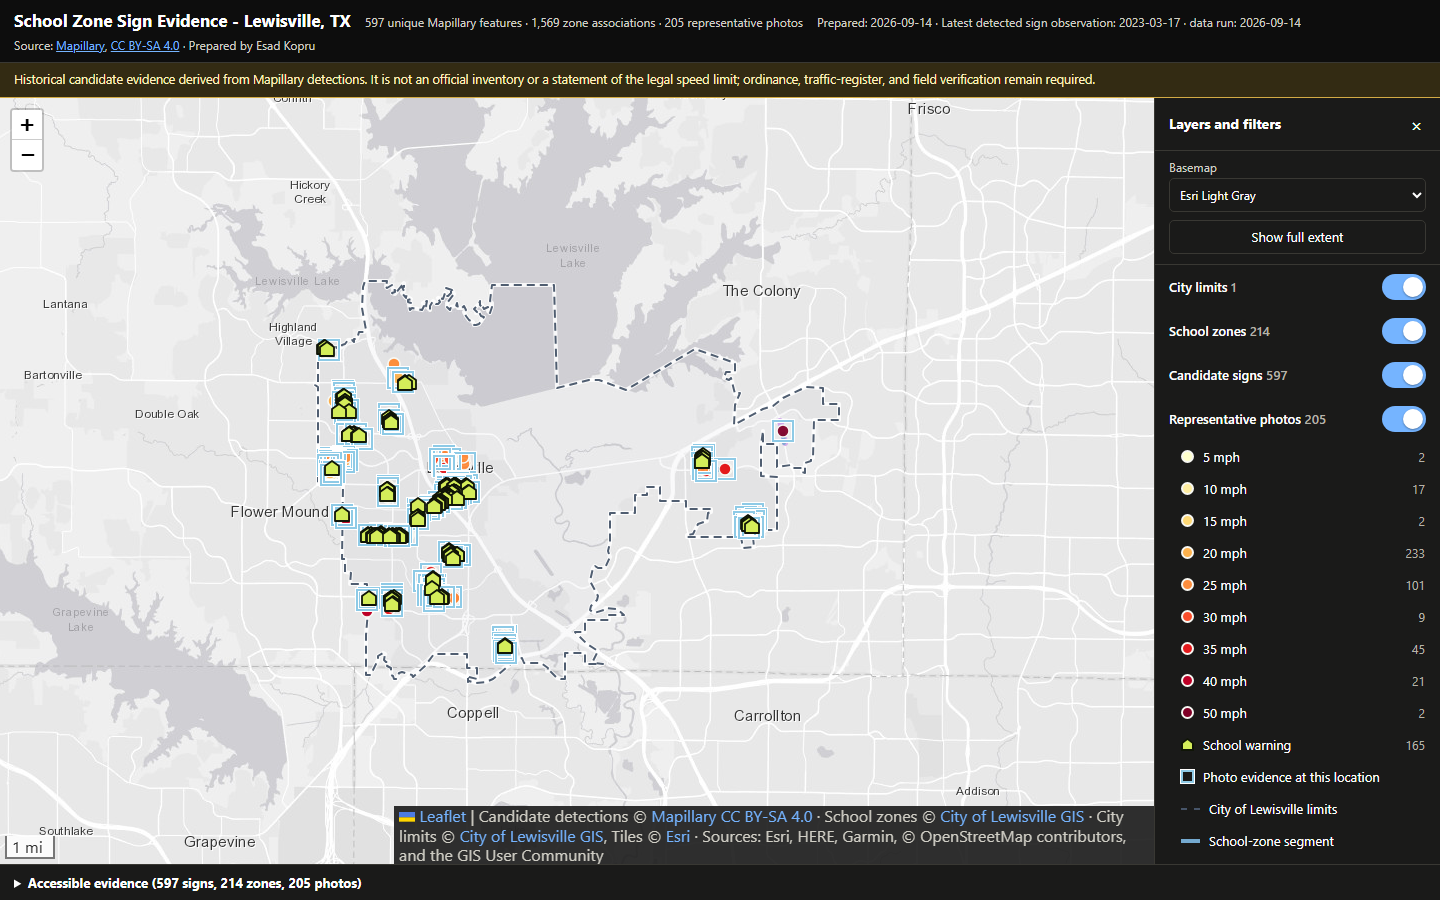
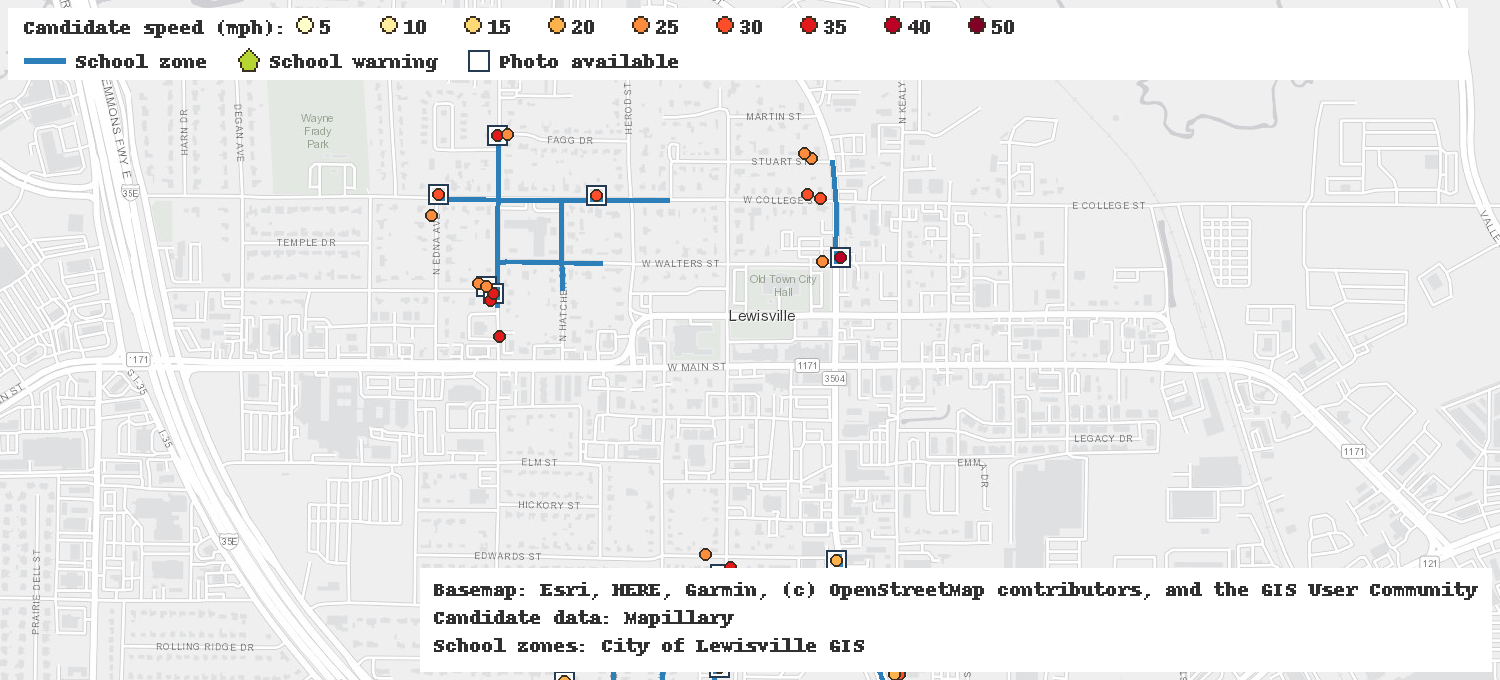
Figures from the September 14, 2026 assessment. Map data: Mapillary (CC BY-SA 4.0), City of Lewisville GIS, and Esri. 2 images. Select an image to view it full size.
My contribution
I built the Python workflow, the interactive map, and the reports. The sign detections come from Mapillary; I did not train a detection model, and the results have not been checked in the field.
Result: The September 14, 2026 assessment covers 214 school-zone street segments and 67 configured ordinance extents, with 597 unique sign candidates, 1,569 candidate-to-segment relationships, and 205 representative photos linked to their sign features. It sets out 12 priority-1 review records. Release v0.3.1 passes 134 tests and reproduces all 36 generated outputs byte for byte.
Tools
- Python
- ArcGIS REST
- Mapillary API
- Leaflet
- GeoJSON and shapefiles
- Automated testing
Every sign observation predates the assessment’s three-year cutoff; the newest is from March 2023. The outputs identify evidence gaps and inspection priorities. They are not an official inventory, a legal determination, or proof of current sign conditions, and no custom detection model was trained: Mapillary provides the detections.
Why counting signs is harder than it looks
A single detected sign can sit near several street segments, so counting every spatial relationship as a sign would inflate the inventory. A query run today can return observations that are years old, and an ordinary road-speed sign can be mistaken for evidence of a school-zone limit.
The workflow keeps one record per unique sign candidate and stores its segment links separately, keeps observation dates apart from processing dates, and carries unknown or conflicting evidence through to the final assessment instead of resolving it quietly.

What the assessment shows
The 597 candidates split into 432 numeric speed signs and 165 school warnings, and their 1,569 segment links are relationships, not extra signs. None of the evidence is recent: the newest sign observation is from March 17, 2023, before the September 14, 2023 freshness cutoff. Most segments show the expected speed value, but only in stale evidence.

Using the explorer
The Leaflet map in the gallery is the main way to review the evidence:
- Search by street and filter by evidence freshness and assessment status.
- Turn the city limits, school zones, candidate signs, and photo locations on and off independently.
- Read the same evidence in keyboard-accessible tables for signs, zones, and photos.
- Use a standalone version that embeds the data and photos, so the overlays work without a network connection; the map also recovers when basemap tiles fail to load.
Built to be rebuilt
Complete builds in two different directories reproduced all 36 generated outputs byte for byte and matched all 511 recorded input hashes, and the cached rebuild also passes in GitHub Actions. Because the build reads cached inputs, it reproduces the release without querying the source services again.
Reviewing the earlier release found defects that v0.3.0 fixed, including exported photos that had lost their links to sign features (none of 205 were linked) and unknown observation dates being treated as stale evidence.
Technical details
Professional · Geospatial Software Developer / Data Scientist · Release v0.3.1, September 14, 2026 assessment
School-zone GIS records, ordinance descriptions, and street-level imagery each describe part of the same review problem. They need to be connected without treating proximity or a detected number as proof of current conditions.
- Read City school-zone geometry through ArcGIS REST and collect existing Mapillary detections and imagery metadata within separate 60 m sign and 30 m imagery search distances.
- Store one record per unique sign candidate and a separate record for each candidate-to-segment relationship, so a sign near several segments is not counted more than once.
- Compare the evidence with a dated ordinance configuration using street-name matching and an explicit three-year freshness cutoff, keeping stale, conflicting, unknown-date, and unmatched evidence in separate categories.
- Produce the review queue, GeoJSON and shapefile exports, an interactive Leaflet map, a coverage report, and a photo catalog from the same assessment.
- Record source hashes and an artifact manifest so cached builds reproduce the release without querying the external services again.