
Income Level Prediction Using R
An R classification study comparing four model families against a majority baseline on historical UCI Adult records, with grouped cross-validation, uncertainty analysis, and ggplot2 results.
Why it matters
Accuracy alone can conceal missed positive cases, weak ranking, or poor probability estimates. Comparing these properties separately makes the strengths and limits of a classifier easier to understand.
My contribution
I built the original project to learn classification in R, then revised it into a reproducible, inspectable study. I made data handling explicit, grouped matching predictor profiles during model selection, compared fixed-threshold errors and probability scores, and used R visualizations to communicate uncertainty and descriptive subgroup differences.
Result
The decision tree made fewer classification errors on the reused test sample, while the forest provided stronger ranking and lower aggregate probability errors. The value is the reproducible comparison and transparent interpretation, not a universal best model.
Tools
- R
- ggplot2
- glmnet
- rpart
- ranger
- e1071
- renv
- Automated checks
Historical data, unweighted results, and a reused test sample limit generalization. This is an educational study, not a deployed or contemporary income estimator.
Results on the reused benchmark
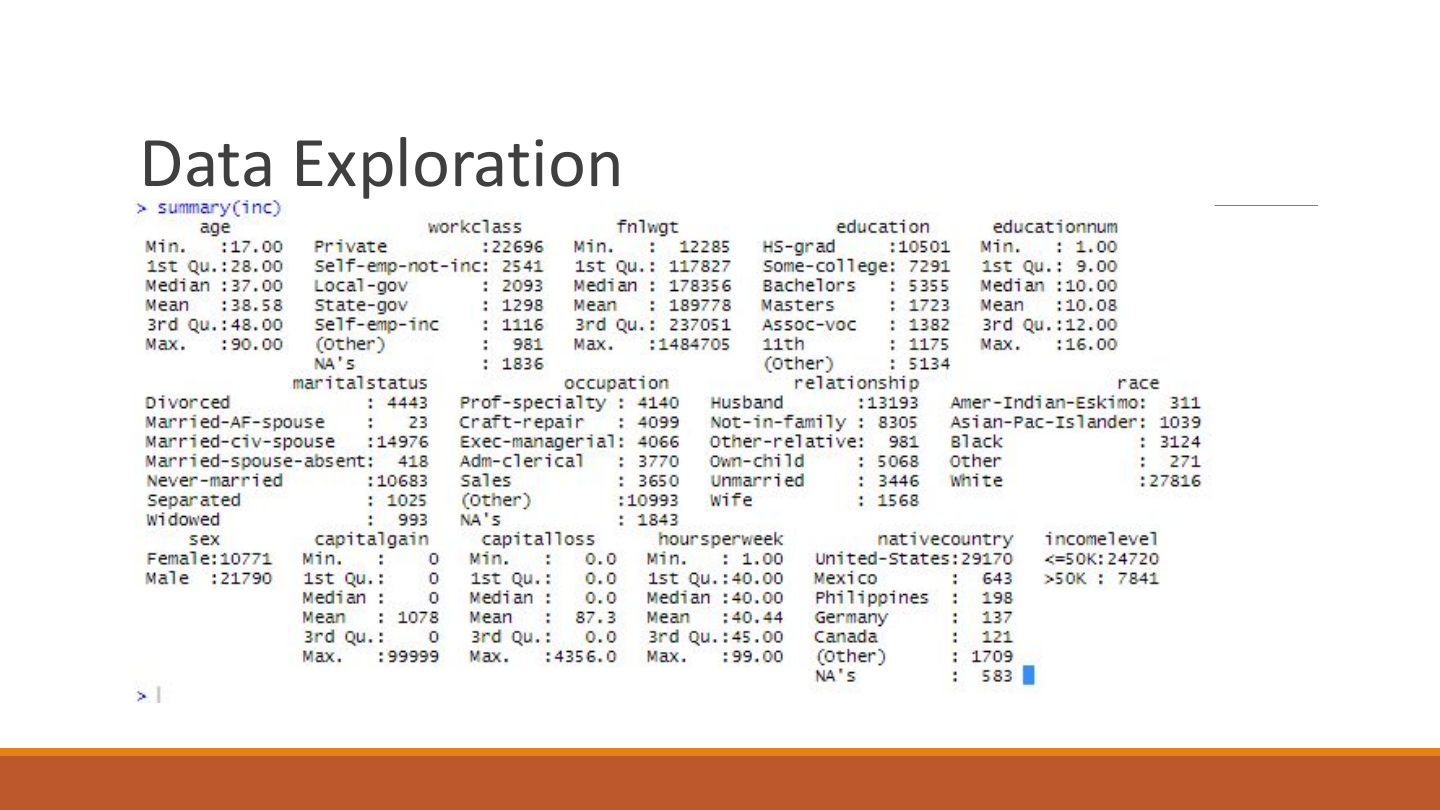
Version 2 retains 32,537 training records and 16,255 test records. Of the test records, 3,840 are >50K, a 23.62% positive-class share. All metrics are unweighted.
Reused test sample. The test file was examined in the earlier project iteration. These results evaluate a reused benchmark and do not provide fresh independent confirmation.
| Model | Accuracy | Balanced accuracy | ROC AUC | Average precision |
|---|---|---|---|---|
| Majority baseline | 76.38% | 50.00% | 0.5000 | 0.2362 |
| Ridge logistic regression | 84.66% | 75.79% | 0.8980 | 0.7354 |
| Decision tree | 86.42% | 77.92% | 0.8910 | 0.7615 |
| Probability random forest | 86.04% | 77.88% | 0.9090 | 0.7933 |
| Linear SVM | 84.80% | 75.94% | 0.8968 | 0.7357 |
Balanced accuracy averages recall and specificity. Accuracy columns are percentages; ROC AUC and average precision are ranking scores. Scroll the table horizontally to read every metric.
Selection and classification
Training cross-validation preferred the forest: 78.32% mean balanced accuracy versus 78.23% for the tree. These are model-selection scores. On the reused test sample, the tree had the highest observed accuracy and made 2,208 errors, versus 2,270 for the forest. Its error count was 42.5% lower than the majority baseline, a relative error reduction rather than a percentage-point accuracy gain.
Ranking and probability quality
The forest led ranking with ROC AUC 0.9090 and average precision 0.7933. It also had the lowest observed Brier score (0.0971) and log loss (0.3137) among probability-producing models. Log loss uses numerical clipping; these scores do not establish perfect calibration. SVM margins are excluded from probability comparisons.
Errors at the fixed threshold
The forest detected 2,397 of 3,840 positive records and missed 1,443, giving 62.42% recall. Compared with the tree, it found 23 additional positives but produced 85 additional false positives.
A small, uncertain difference
The tree-minus-forest balanced-accuracy difference was +0.043 percentage points. Its conditional 95% interval ran from -0.523 to 0.626 points. Including zero establishes neither a clear advantage nor equivalence.
How to read uncertainty and subgroup differences
The 1,000 paired cluster-bootstrap draws condition on the fitted models and reused test sample. They exclude training and model-selection variability, so they are not fresh independent confirmation.
Subgroup charts describe historical recorded categories, with metric-specific denominators and Wilson intervals. Sex and race remain predictors. These estimates do not certify fairness or establish causal discrimination. Profile comparisons have different case mixes and do not identify people.
Version 2 results gallery
Ten R-generated charts from saved aggregates. These are a visualization update, not a new model run. Four selected views lead the gallery. Select any chart to enlarge it.


View six more results chartsHide extra results charts


Reports and supporting data
The completed technical report, current 16-slide presentation, and chart book are separate documents.
- Read the technical report (PDF, 14 pages) (opens in a new tab or window)
- View the presentation (PDF, 16 slides) (opens in a new tab or window)
- Download the results chart book (PDF, 10 pages) (opens in a new tab or window)
Inspect the eleven aggregate summary tables (CSV)
Model scores, counts, settings, and descriptive summaries. No raw records or individual predictions are published here.
- Model performance and error summary (CSV) (opens in a new tab or window)
- False-positive and false-negative counts (CSV) (opens in a new tab or window)
- Retained class balance (CSV) (opens in a new tab or window)
- Sample retention counts (CSV) (opens in a new tab or window)
- Aggregate calibration summaries (CSV) (opens in a new tab or window)
- Calibration gaps by probability bin (CSV) (opens in a new tab or window)
- Cross-validation candidate results (CSV) (opens in a new tab or window)
- Selected cross-validation fold scores (CSV) (opens in a new tab or window)
- Subgroup error rates and denominators (CSV) (opens in a new tab or window)
- Seen and novel profile comparison (CSV) (opens in a new tab or window)
- Headline statistics and paired intervals (CSV) (opens in a new tab or window)
Data: Becker, B. and Kohavi, R. (1996), Adult, UCI Machine Learning Repository (opens in a new tab or window). DOI 10.24432/C5XW20 (opens in a new tab or window). Dataset license: CC BY 4.0 (opens in a new tab or window). Analysis and chart presentation by Esad Kopru. The dataset license does not grant a license to the repository code.
Original historical presentation
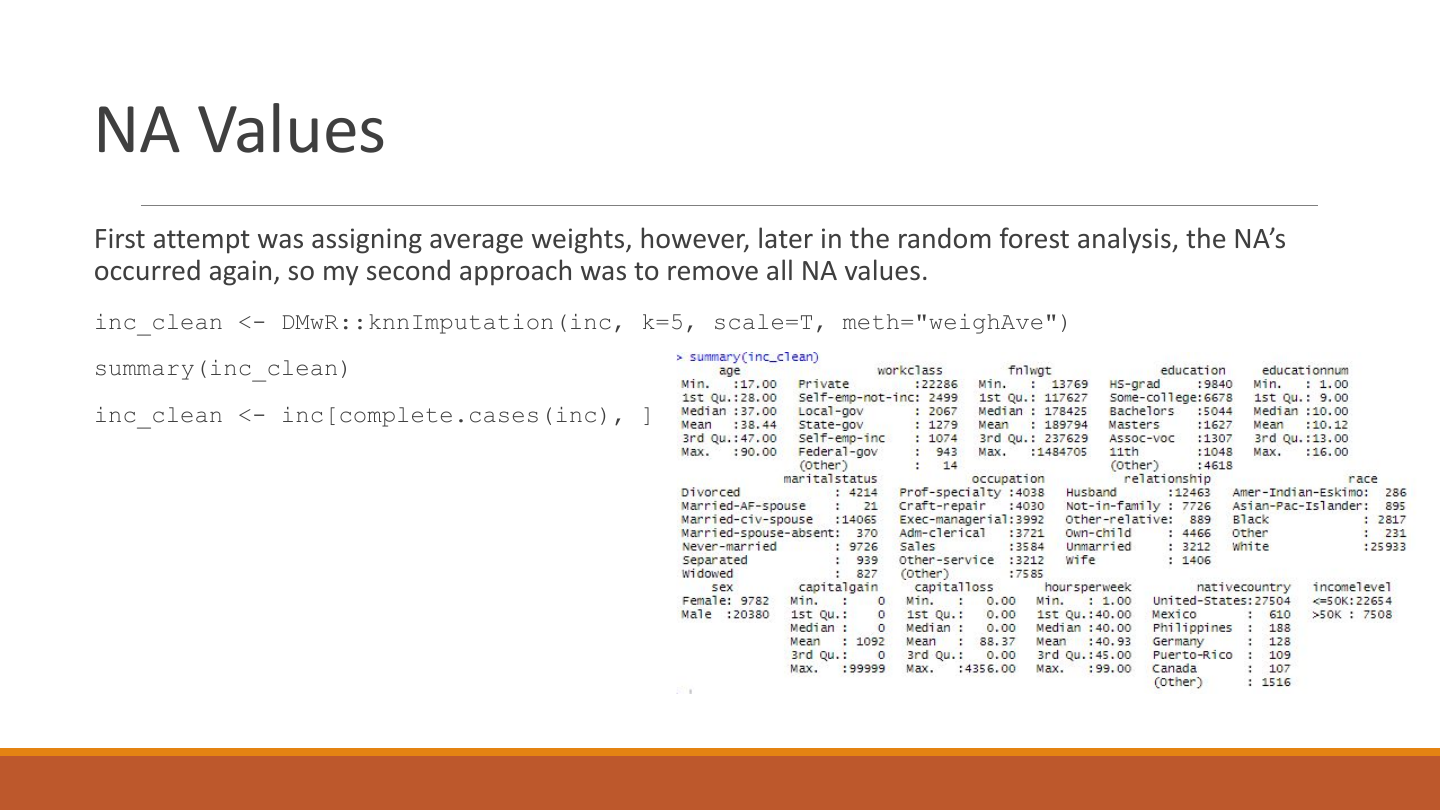
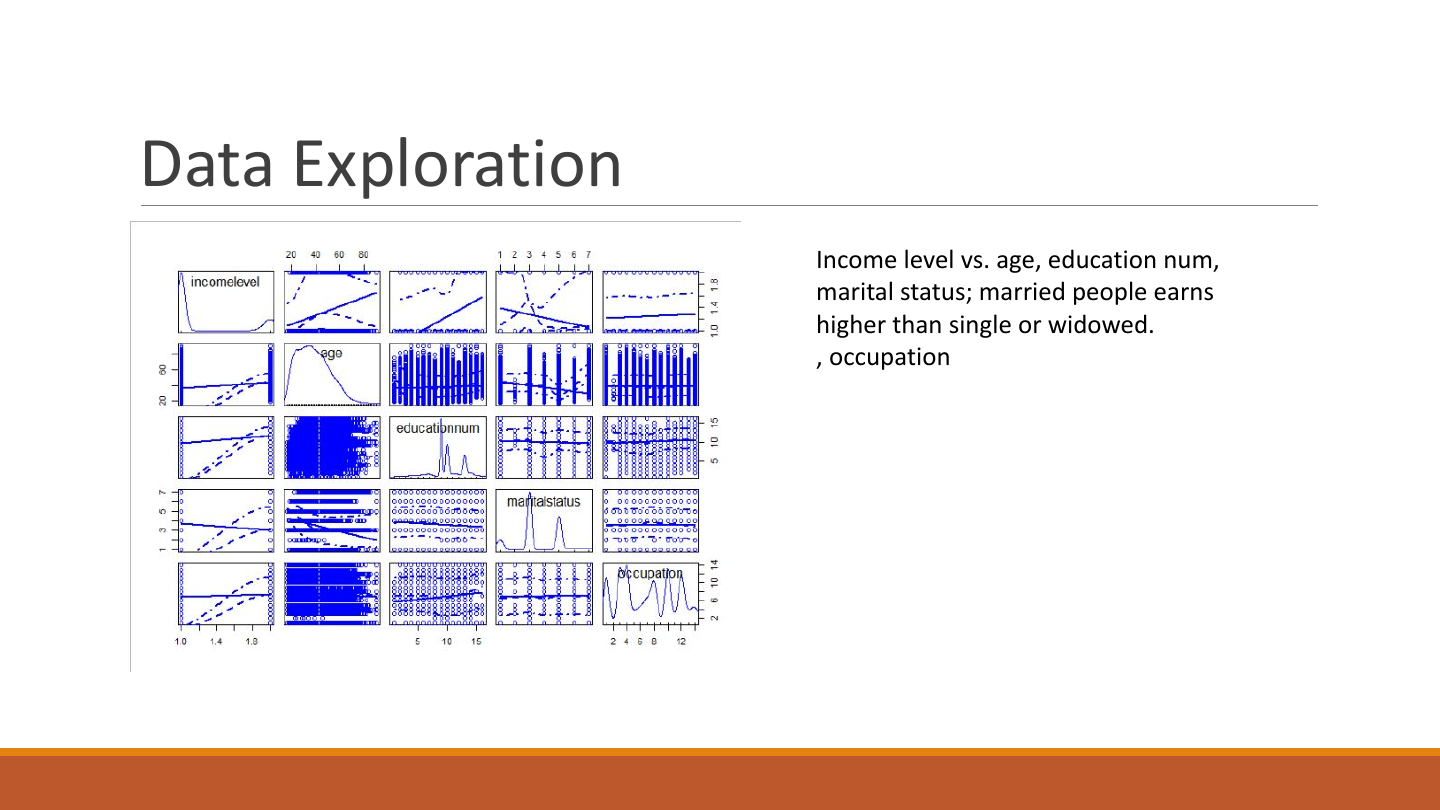
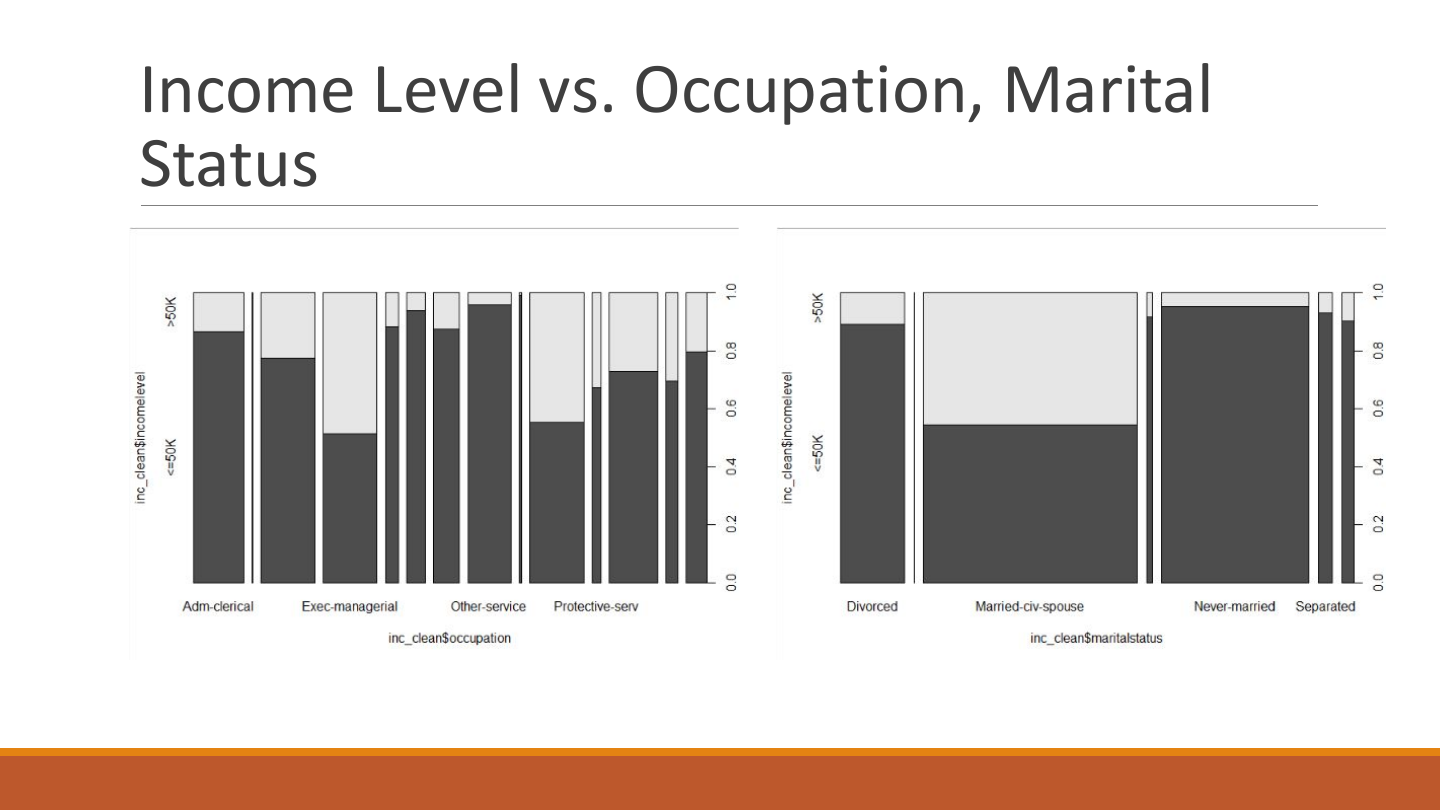
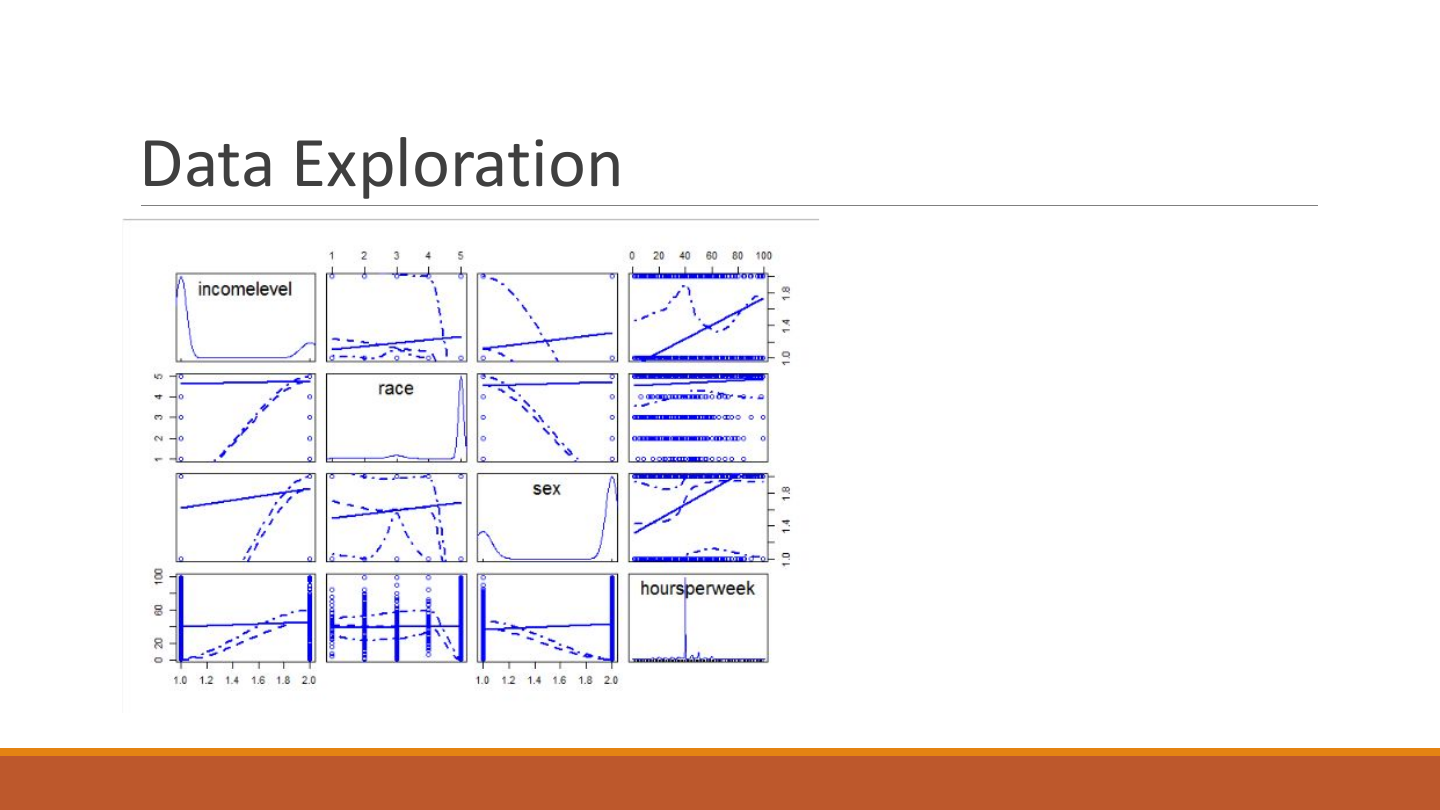
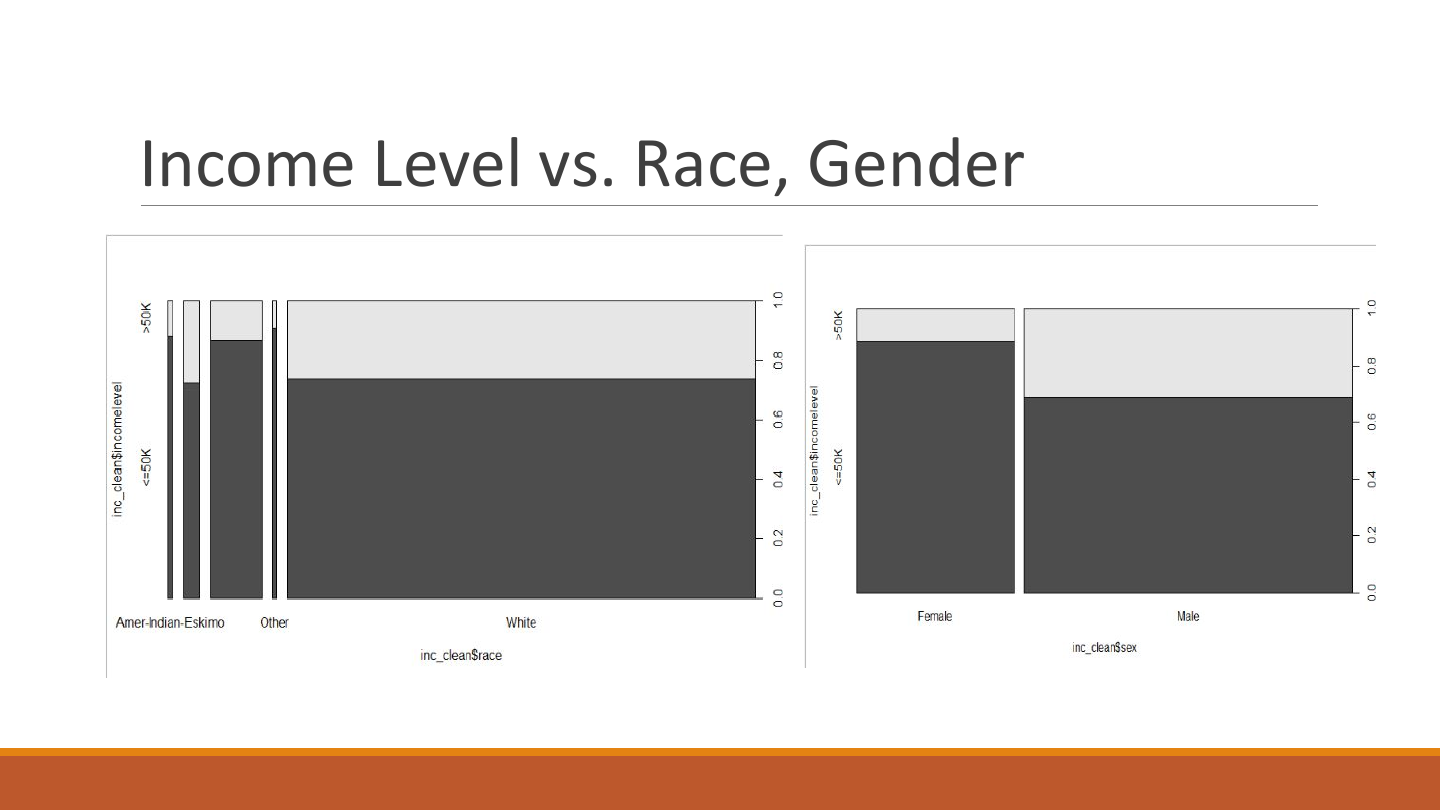
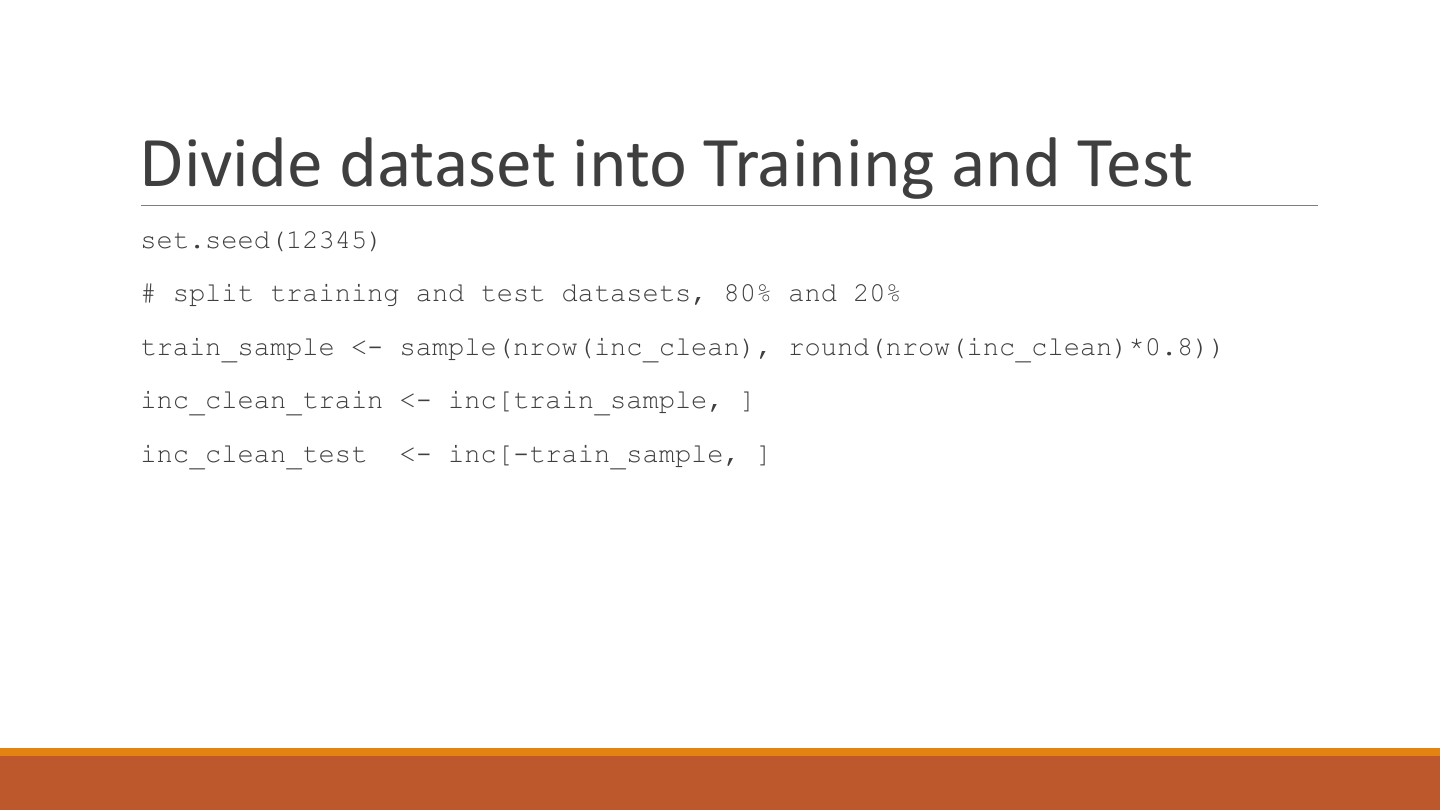
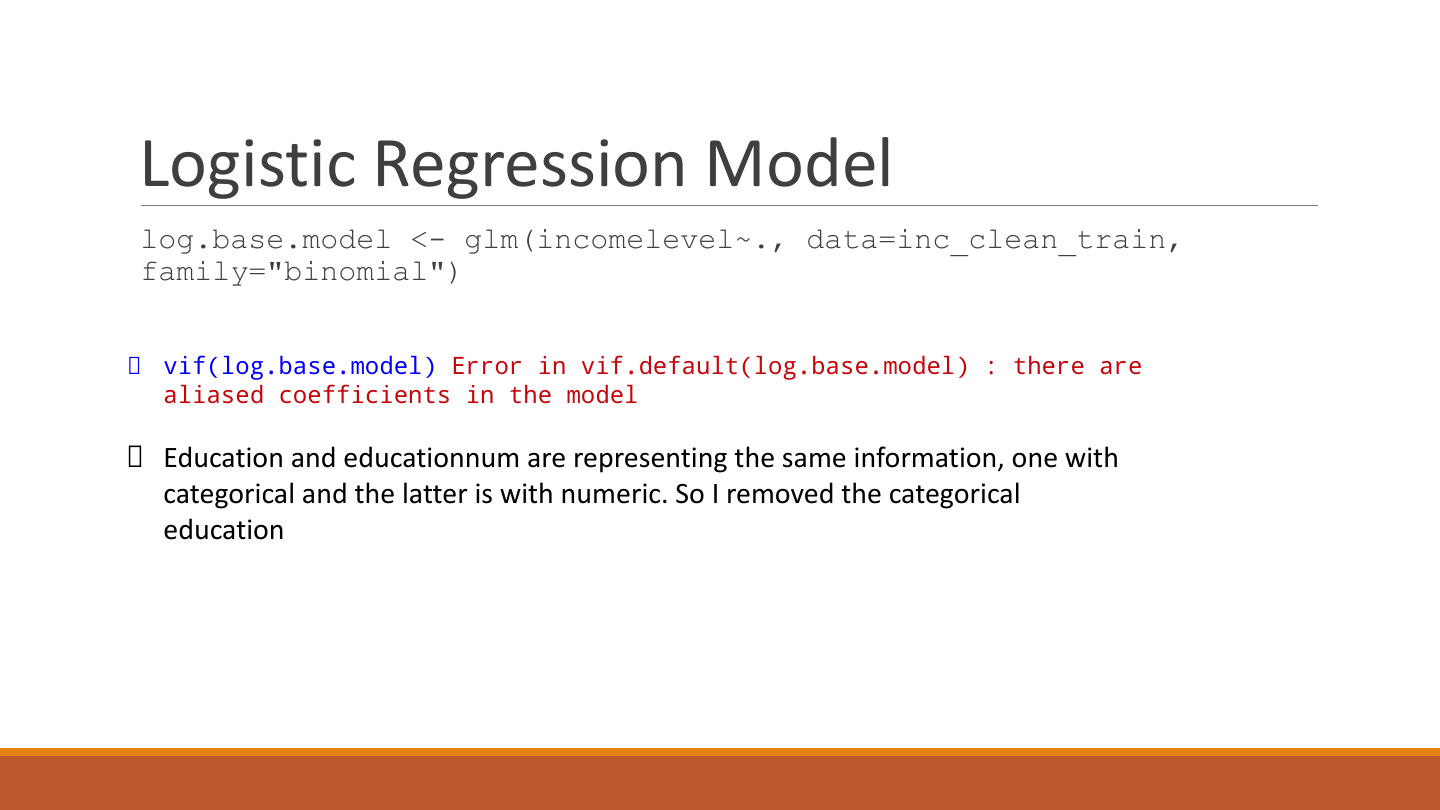
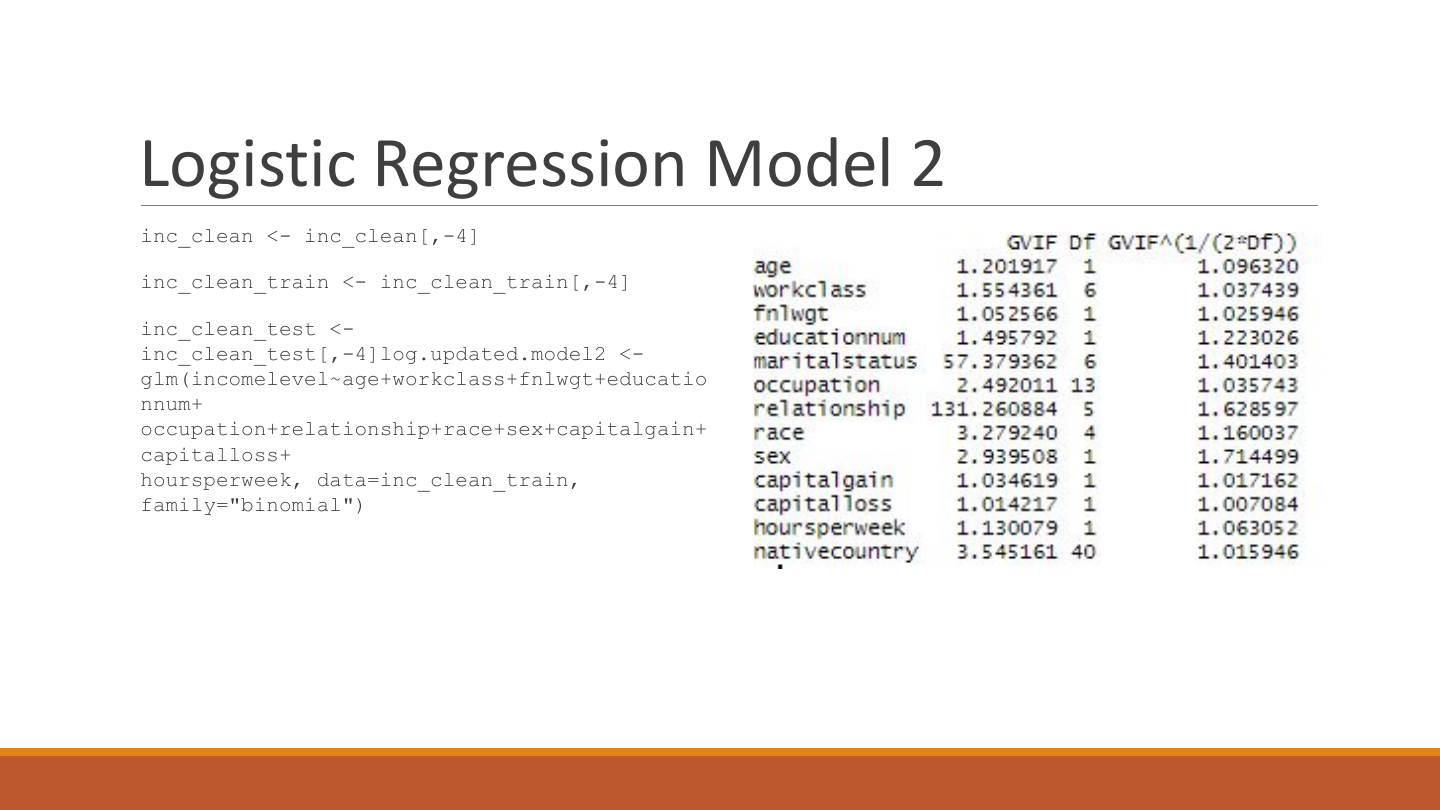
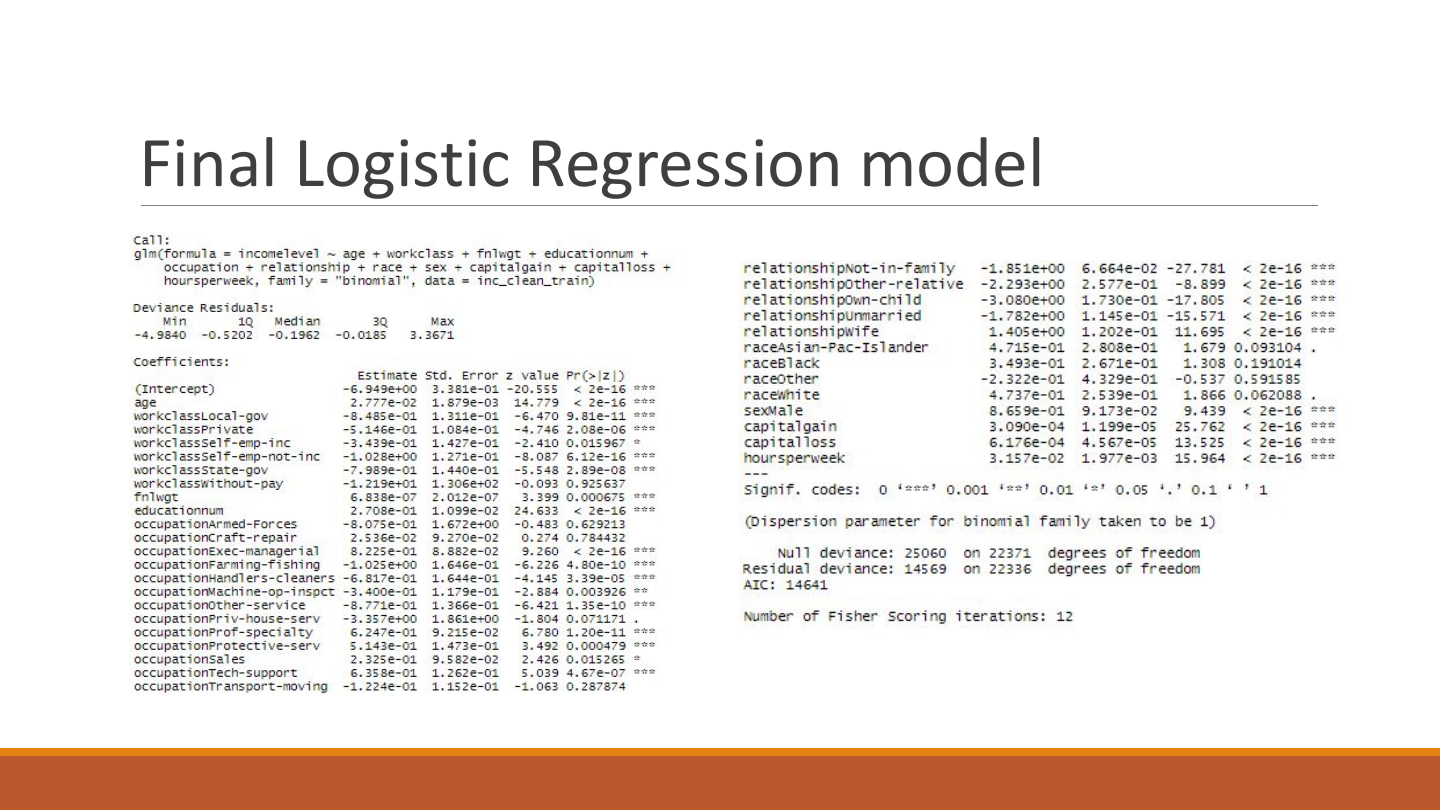
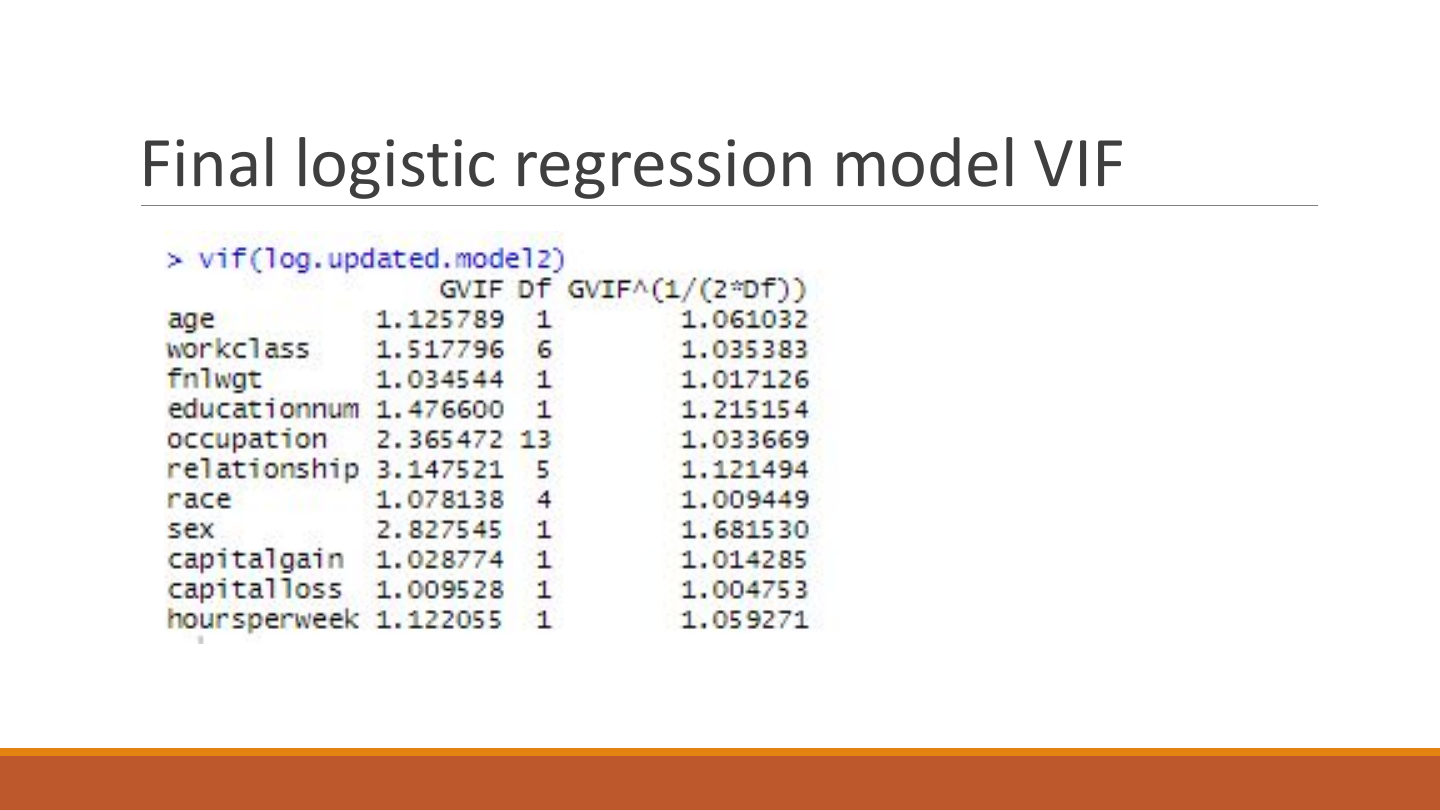
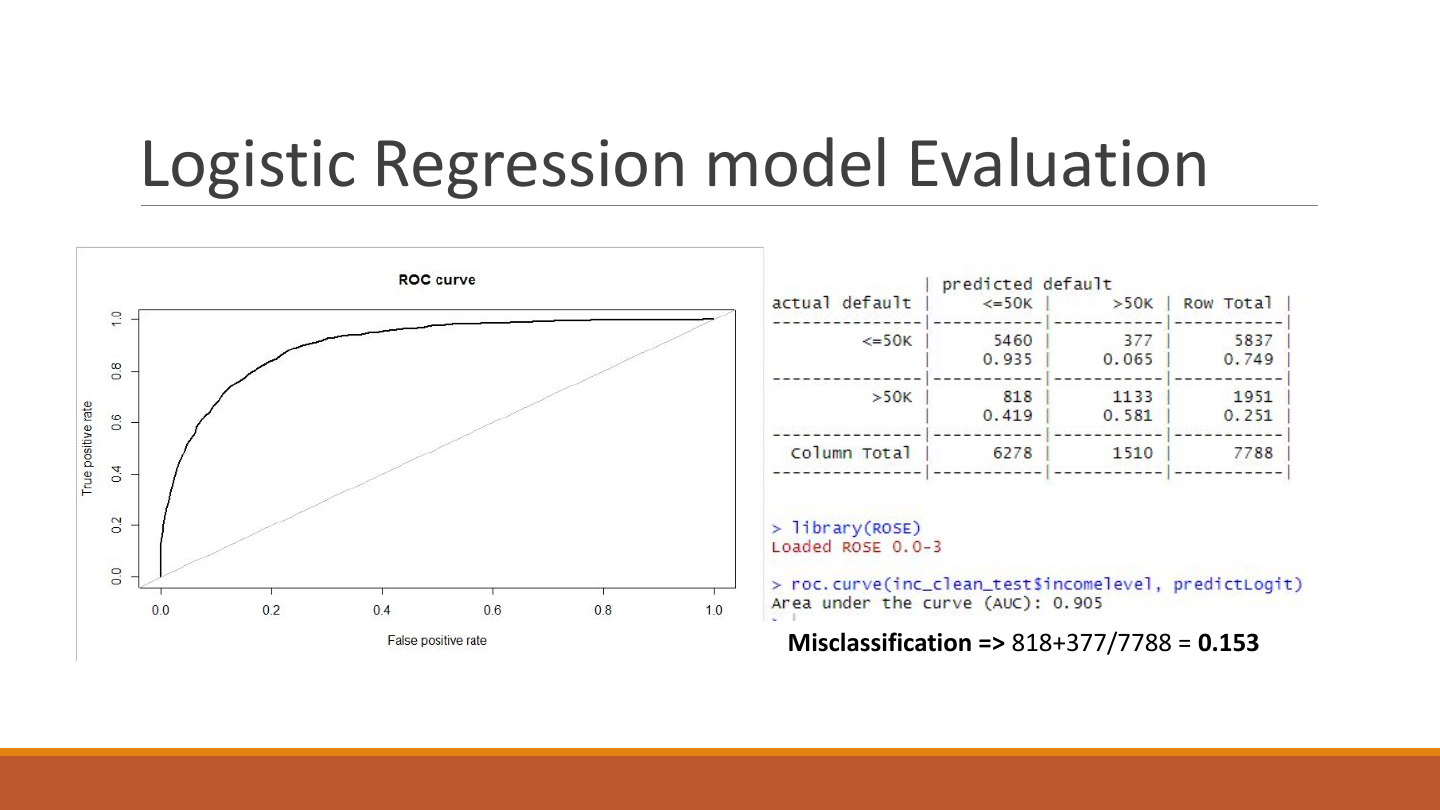
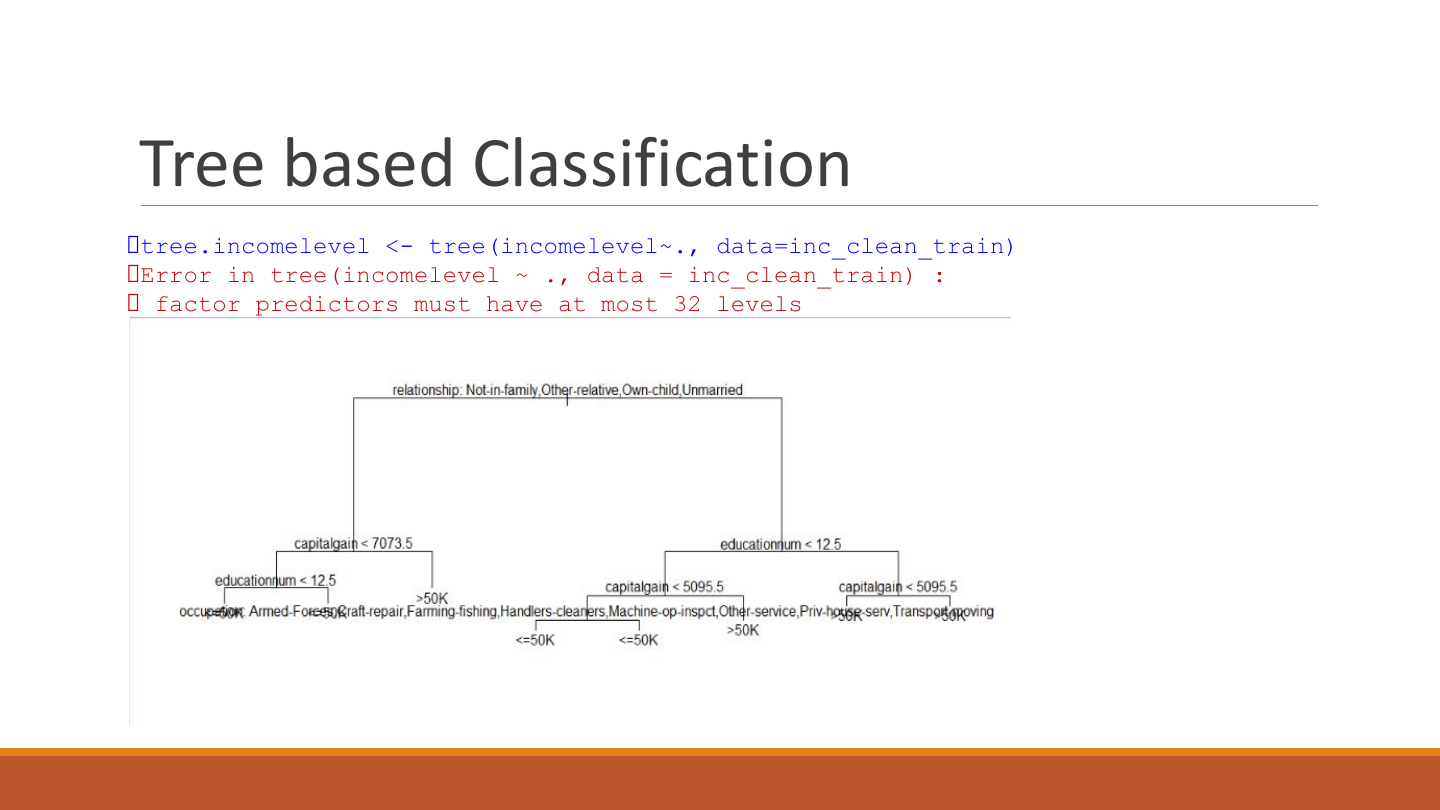
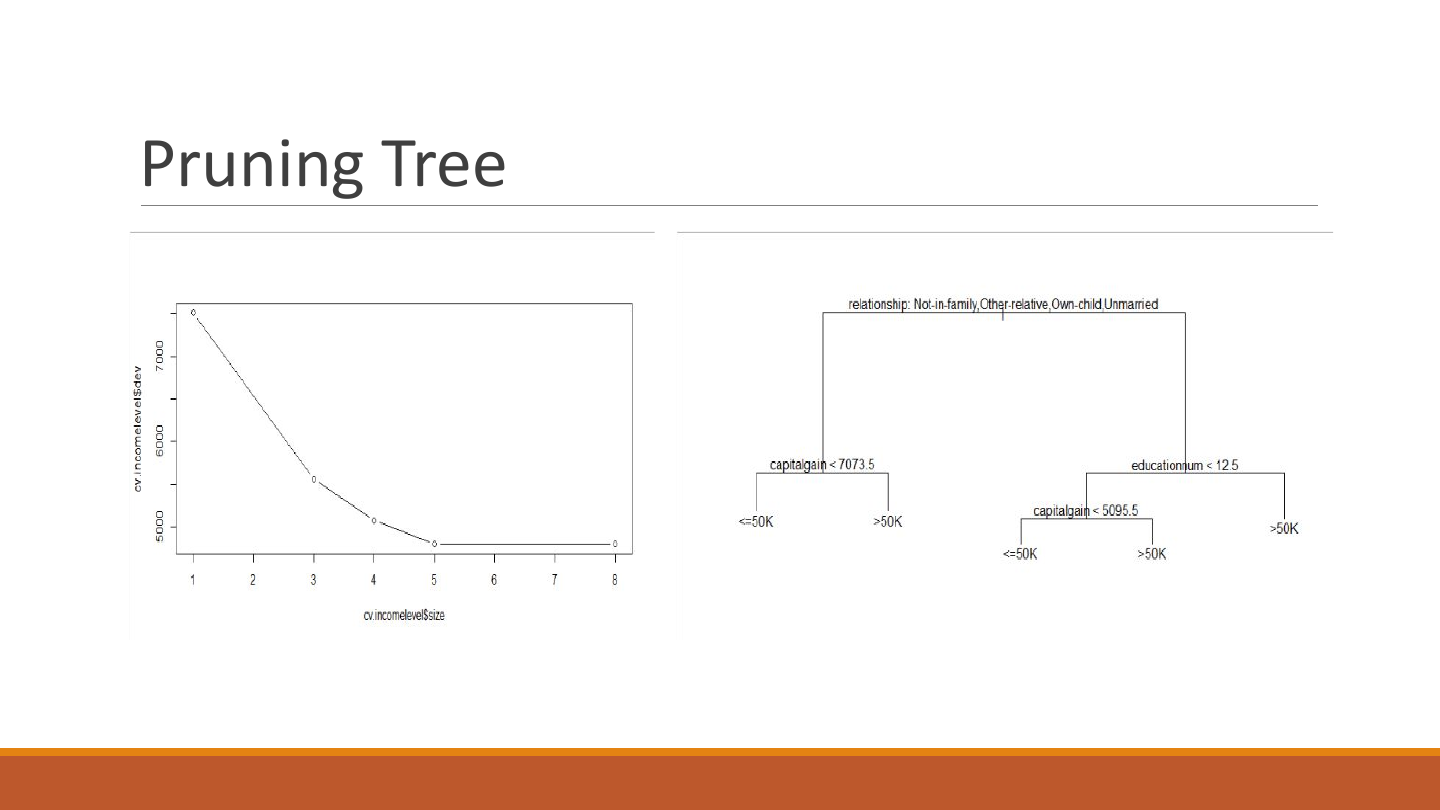
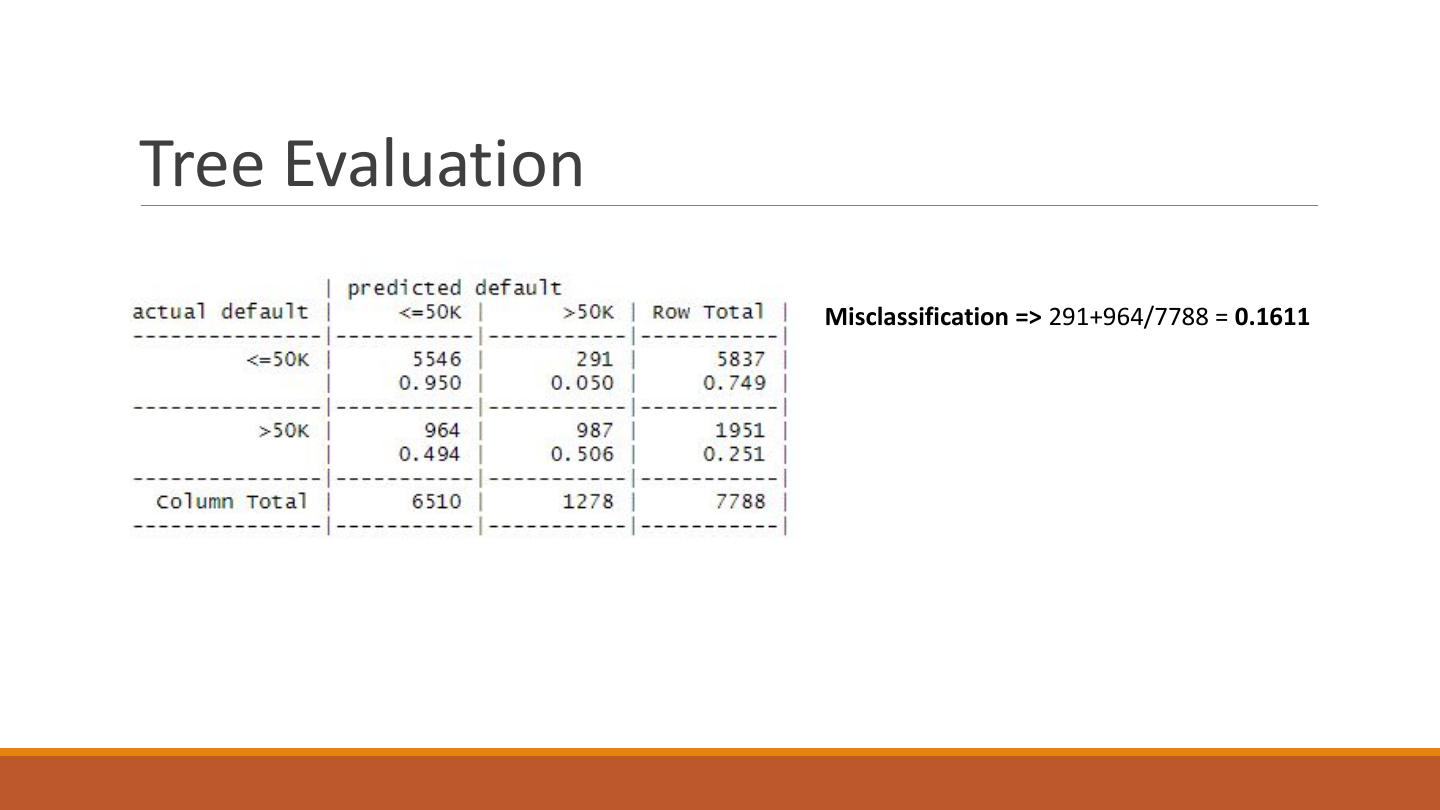
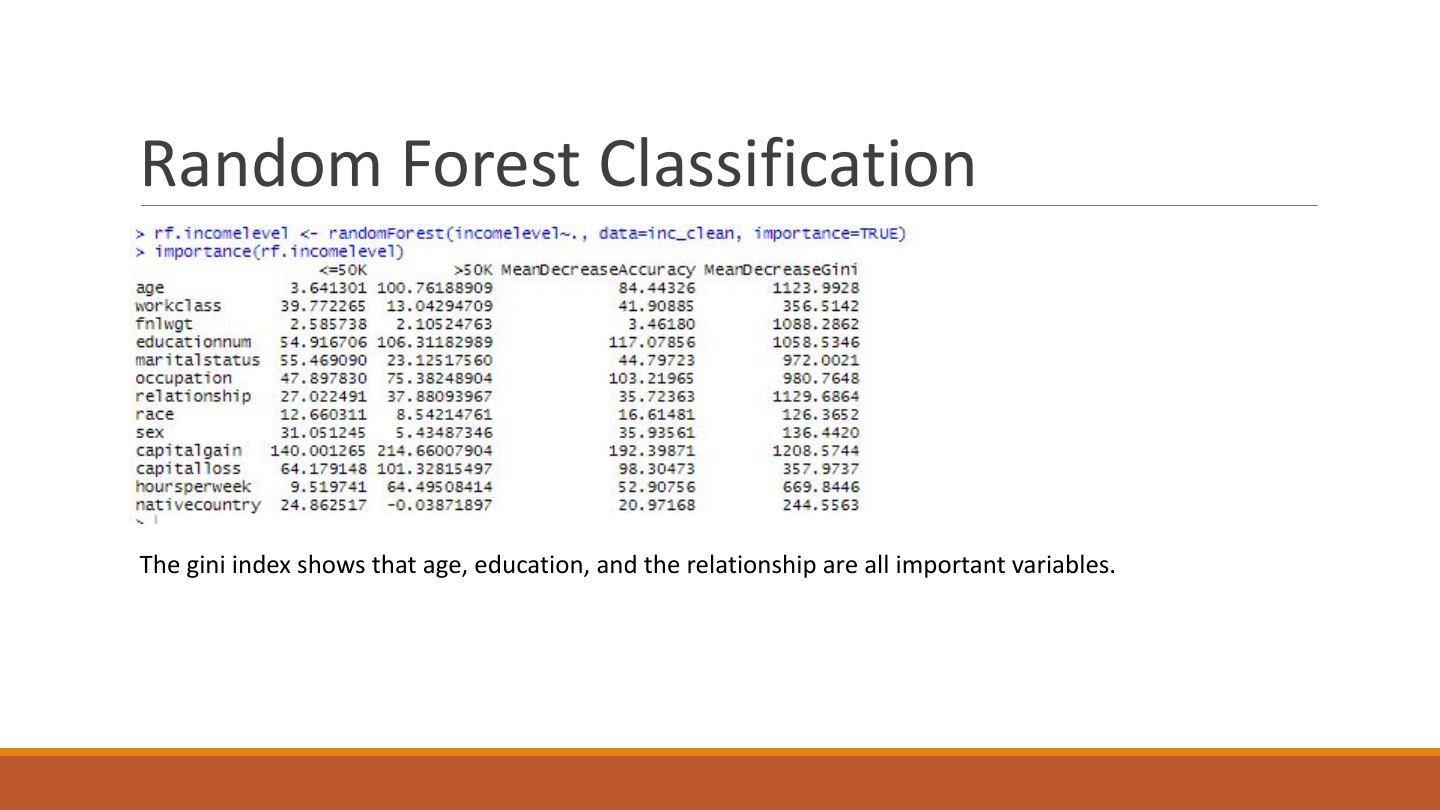
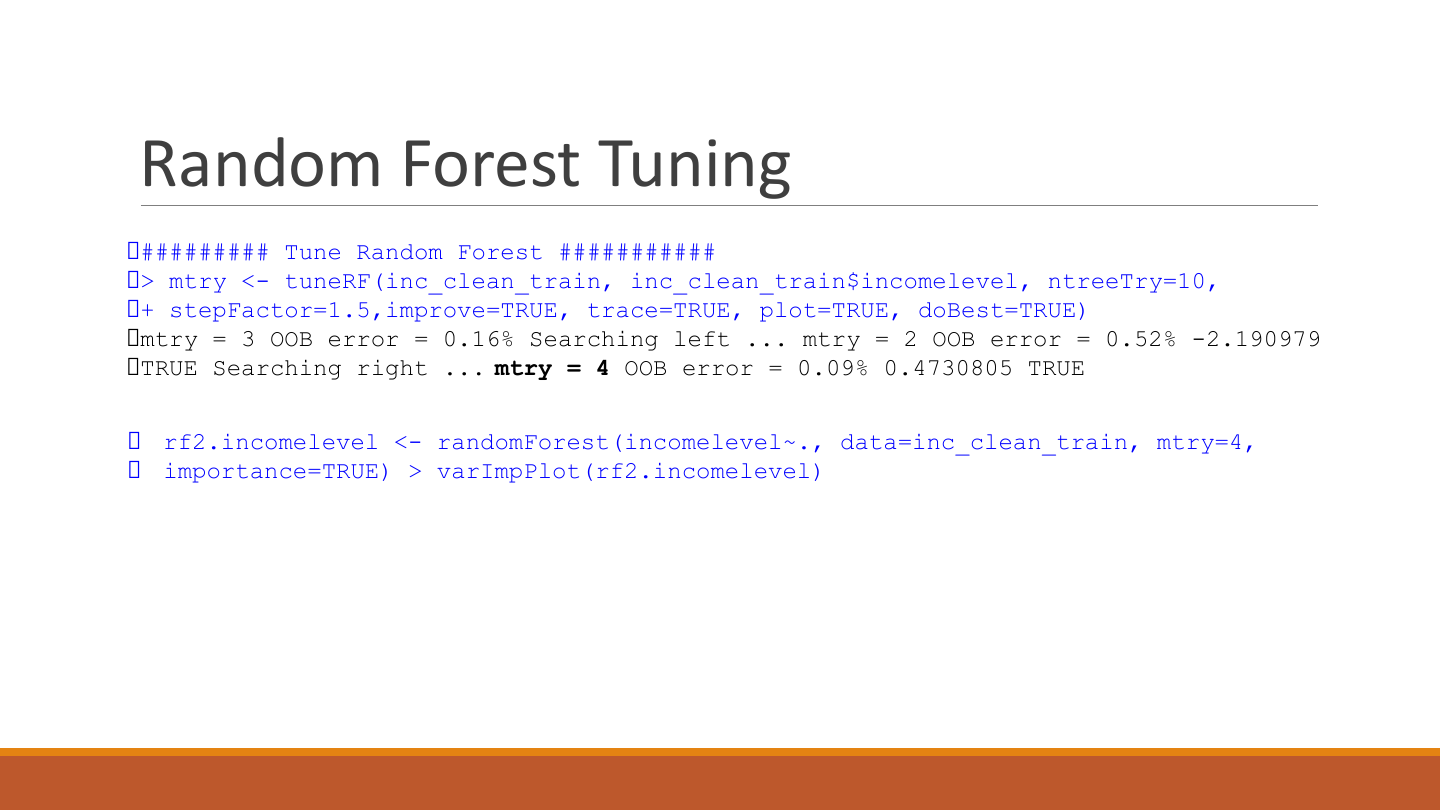
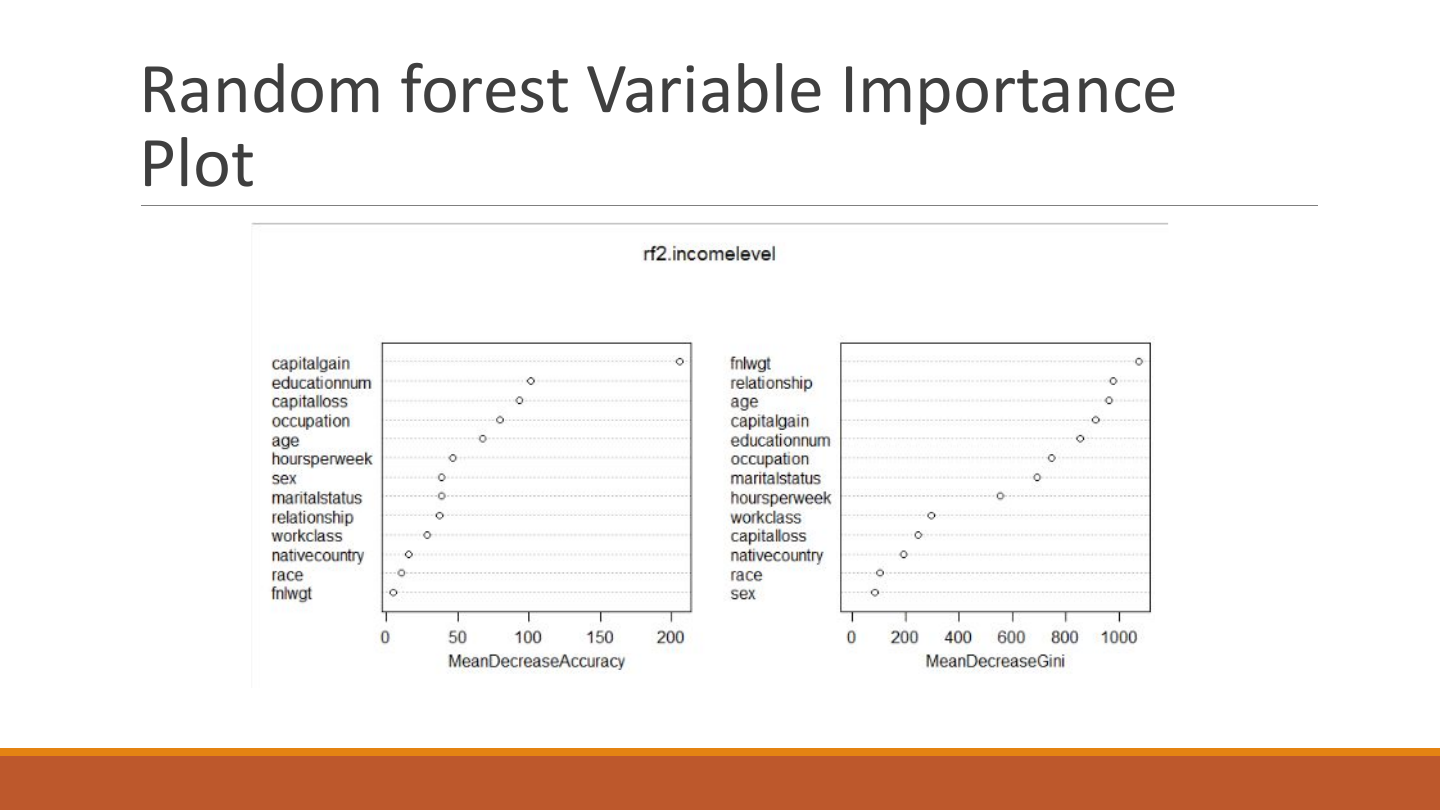
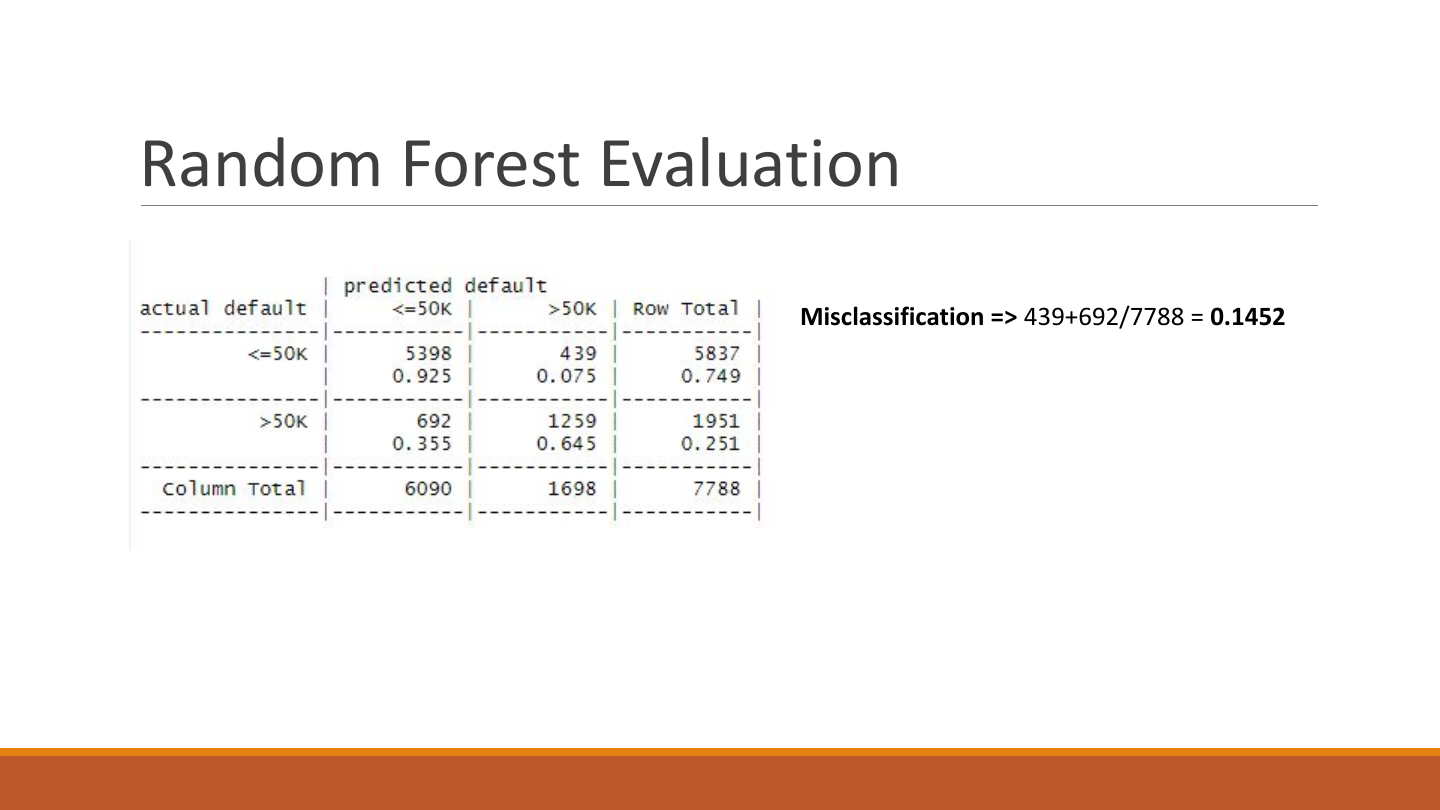
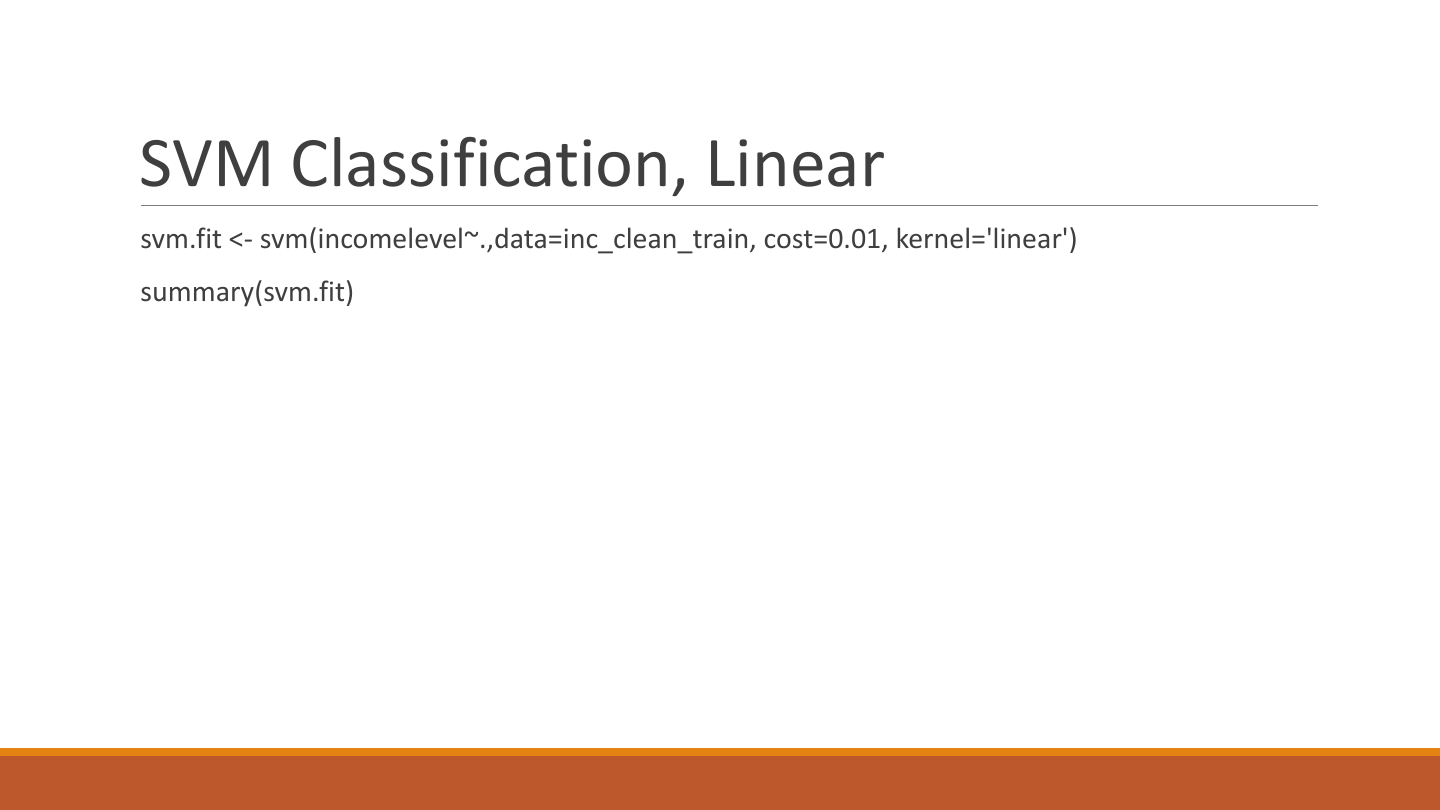
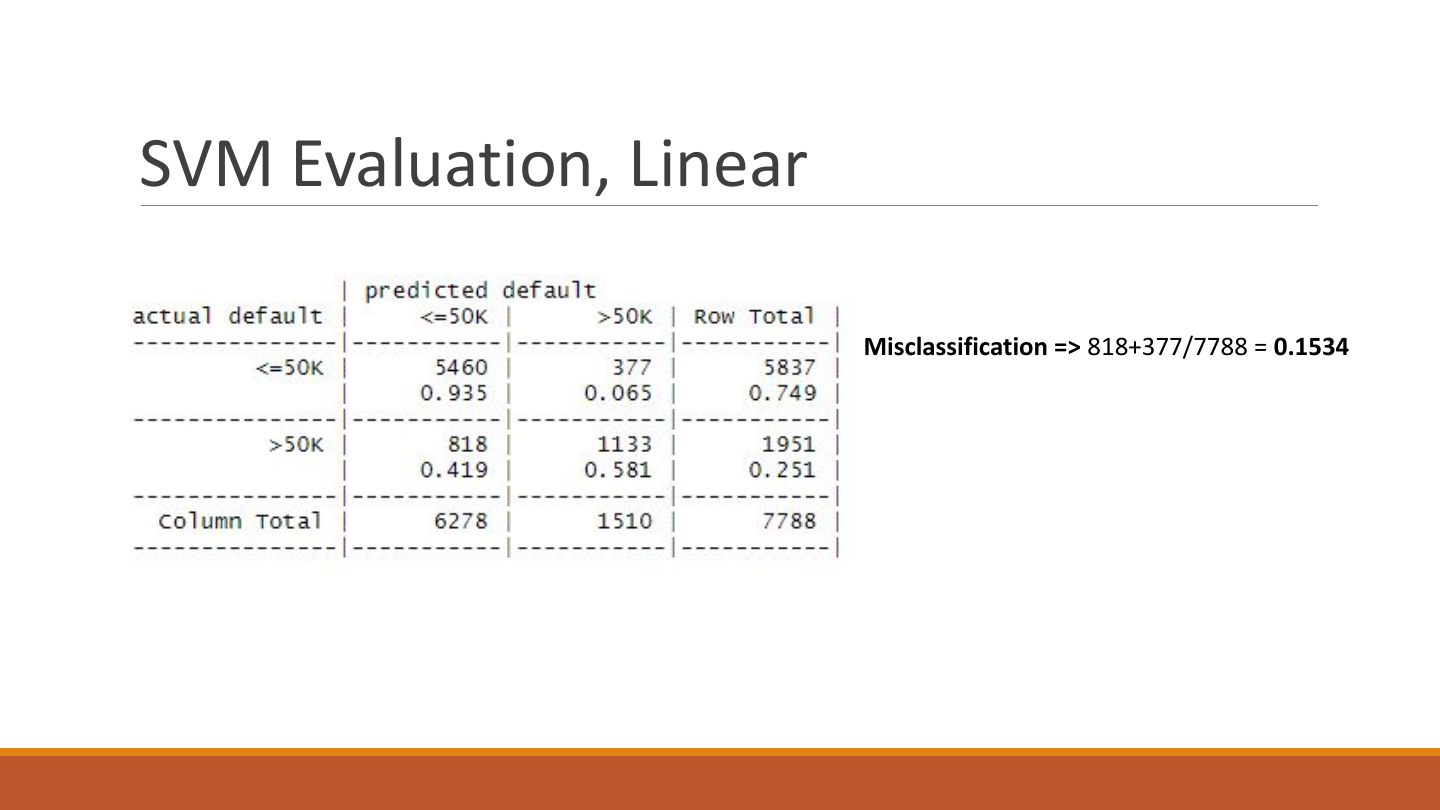
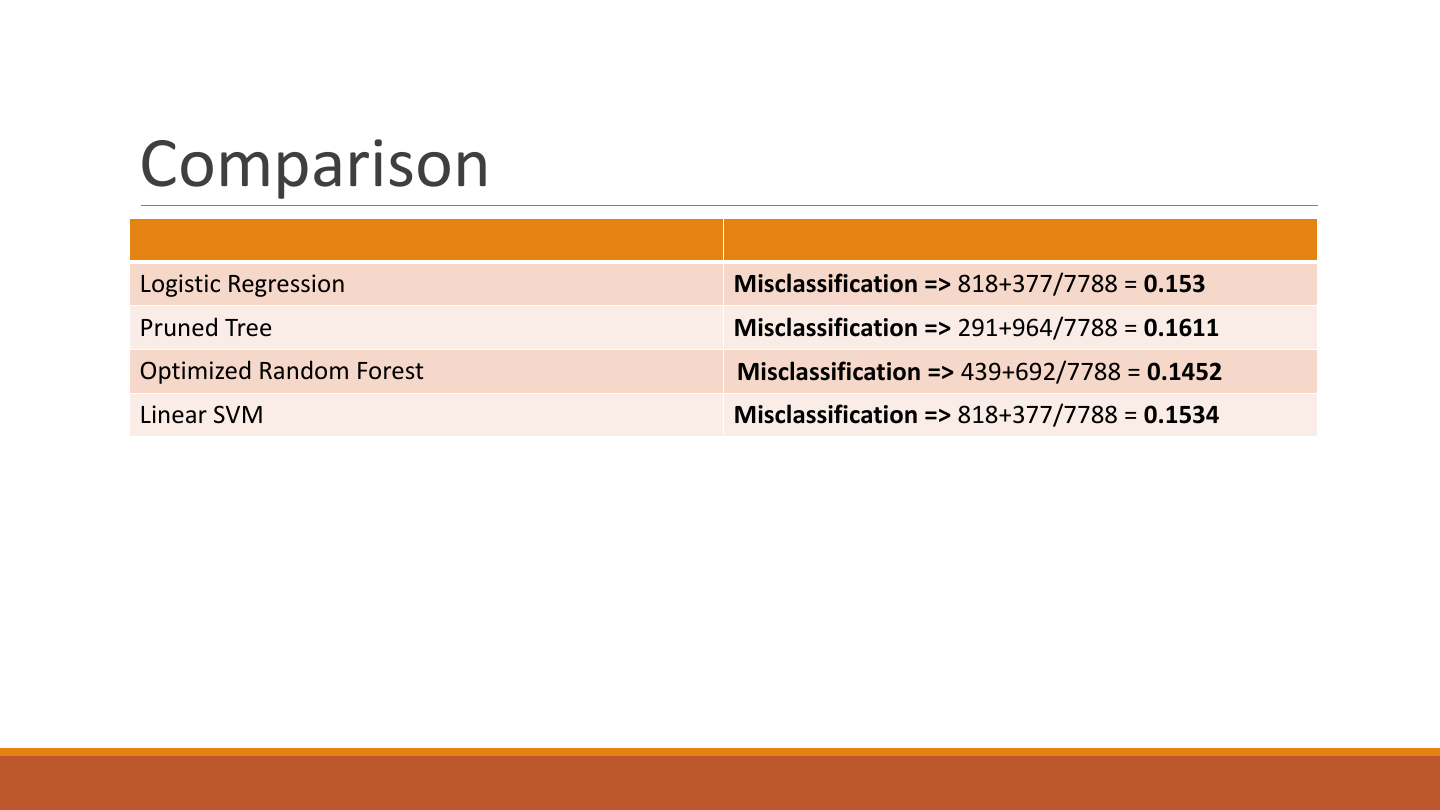
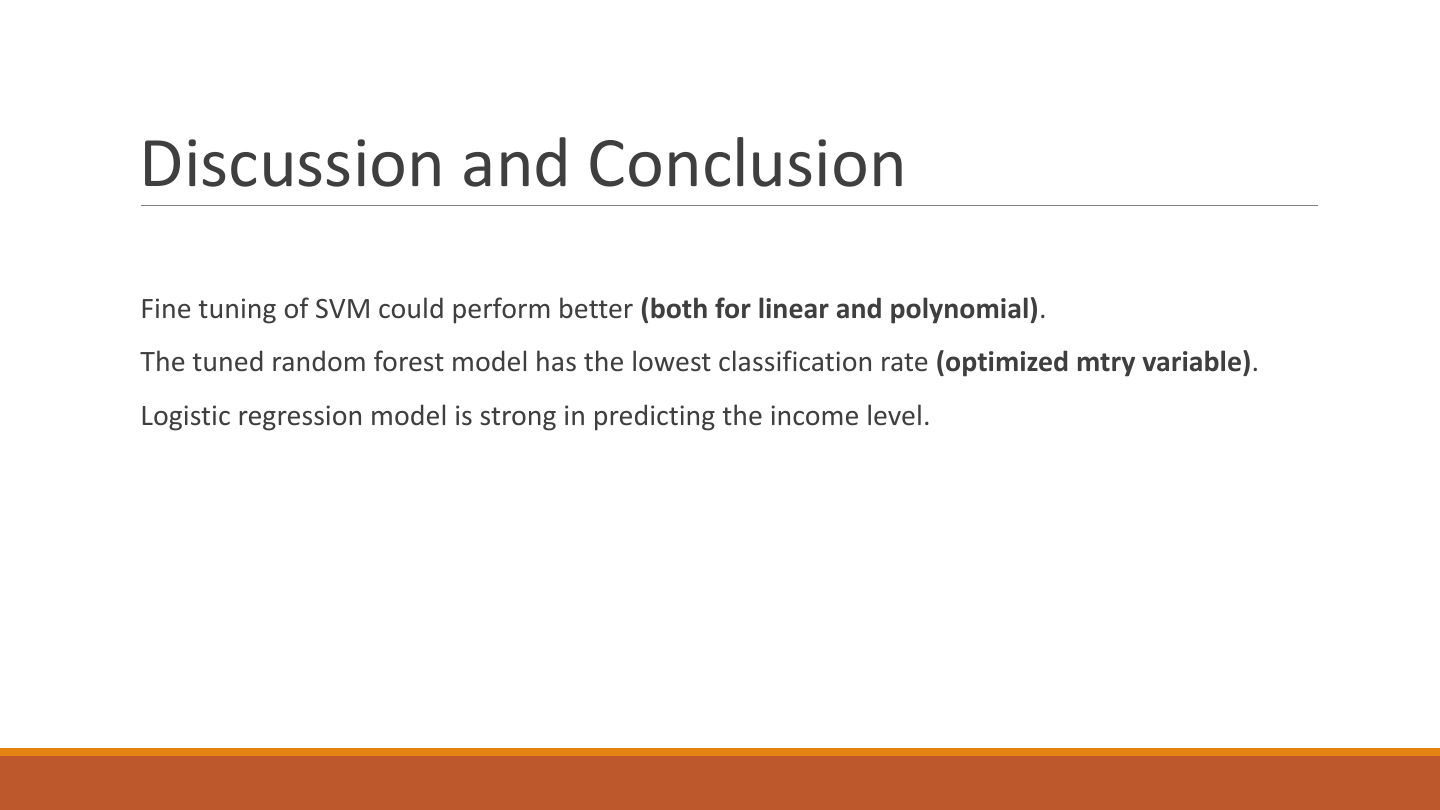
The 26 original slides document the earlier learning project. Their historical metrics are separate from version 2. The current 16-slide presentation is available as a PDF above.
View the 26 historical slidesHide historical slides
Technical details
Independent learning project · Reproducible classification study
Classify the historical income categories >50K and <=50K while comparing model behavior on the same records.
- Remove identical full training records. Exclude test records whose raw predictor signature appears in the original training file, without consulting test labels. Matching profiles are not verified person identities; conflicting-label training profiles are retained.
- Keep matching profiles together across five training folds, grouped by all 14 raw predictor fields. Learn imputation, category encoding, and scaling within each training fold. Select settings by mean fold balanced accuracy, the average of recall and specificity.
- Compare ridge logistic regression, a decision tree, a 500-tree probability random forest, a linear SVM, and a majority baseline. Thresholds remain fixed: probabilities above 0.5 or oriented SVM margins above zero predict >50K; ties predict <=50K.
- The code audit corrected record alignment, evaluation leakage in the historical script, score-threshold interpretation, and ROC inputs. Several methods changed together, so score changes cannot be attributed to one correction.
- Preserve source and aggregate evidence, locked package versions, and automated checks. The ten results-summary charts redraw saved aggregates; they do not represent another model run, threshold search, recalibration, or new bootstrap calculation.