
Historical property value analysis
A difference-in-differences analysis of residential appreciation near business openings, with sensitivity checks and a critical review of what the estimates can support.
Project gallery
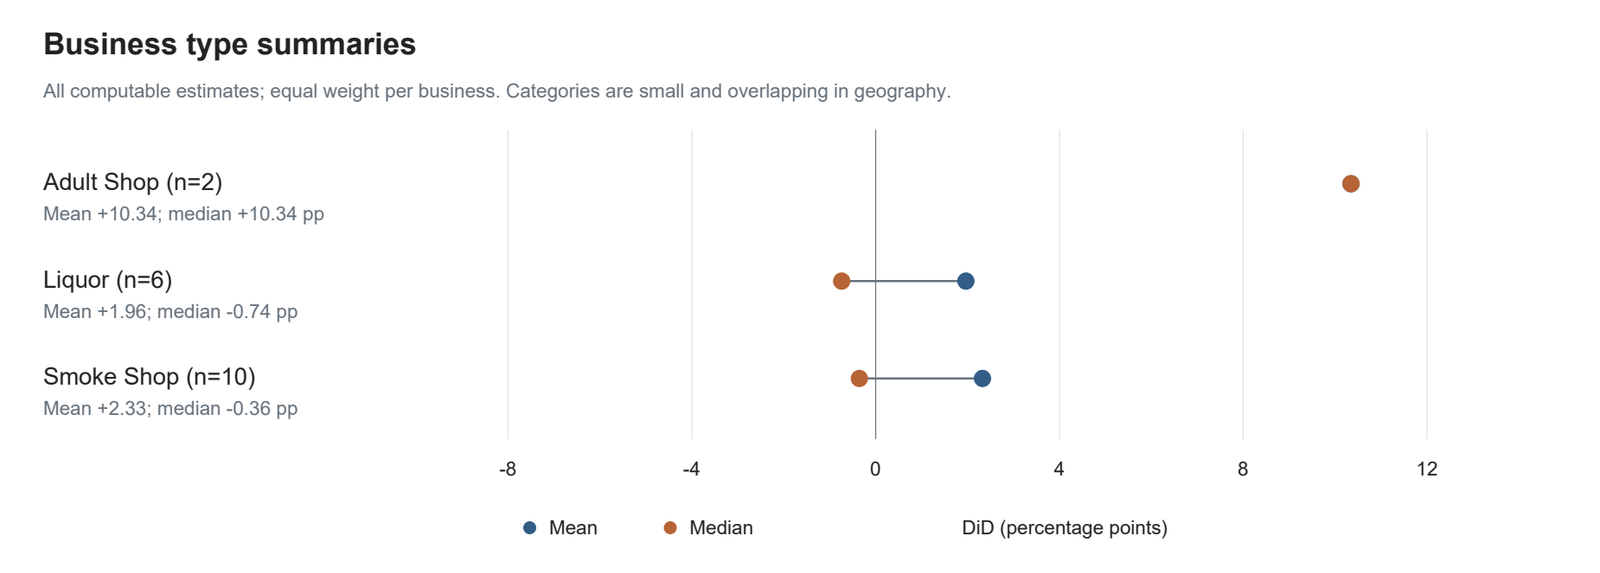
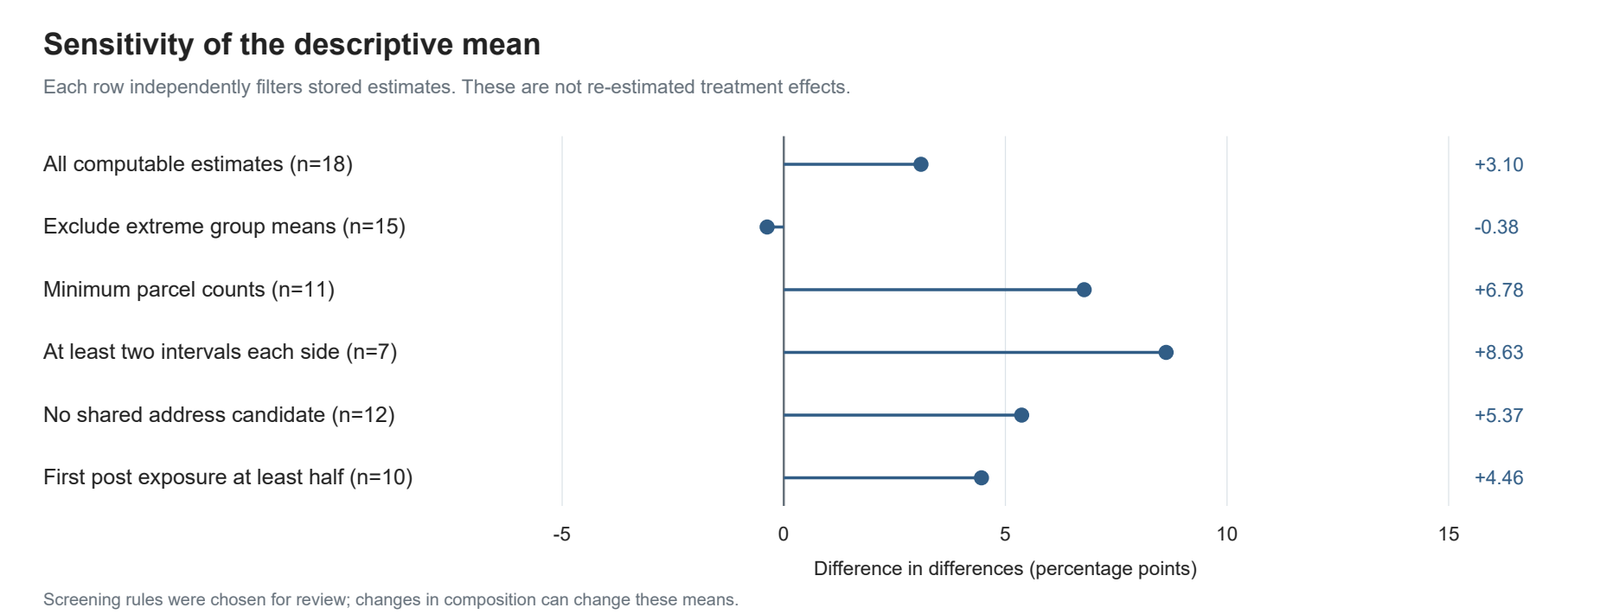
Aggregate charts from the version 4 report; individual businesses are not shown. 2 images. Select an image to view it full size.
My contribution
I built and ran the analysis: distance-based exposure groups, one difference-in-differences estimate per opening, and sensitivity checks on the overall summary. I then reviewed my own method, documented where it falls short, and released corrected reports with a tested estimation core. The estimates are descriptive; I did not produce significance tests or a causal estimate.
Result: Of 63 businesses, 37 opened within the 2021–2024 window and 18 had enough parcels for an estimate. The estimates do not point in a consistent direction: nine are negative and nine positive, the median is +0.18 percentage points, and the mean of +3.10 falls to −0.38 when three estimates with extreme group means are removed. Thirteen cross a 2-percentage-point magnitude screen, which is not a significance test.
Tools
- Python
- pandas
- NumPy
- Difference-in-differences
- Sensitivity analysis
- ArcGIS Pro
- ArcPy
These are descriptive estimates on appraised values, not sale prices. There are no standard errors, confidence intervals, or pre-trend checks, so they neither establish nor rule out an effect. The original parcel data is no longer available, so the corrections could not be rerun on it. Business names, addresses, and parcel records are not shared.
The question and the design
Each opening gets its own estimate. Openings happened in different years, and a pooled two-way fixed-effects model can be biased when treatment timing is staggered, so the study does not pool them. The trade-off is that there is no single overall effect.
Group rates are averages of parcel percentage changes, not the percentage change of an average value.
- Annual appreciation (%) = 100 × (current value − prior value) ÷ prior value, for each parcel.
- Pre gap = nearby minus comparison appreciation before the opening; post gap = the same difference after it.
- Contrast = post gap − pre gap. A negative contrast means the gap decreased; it does not by itself mean nearby values fell.

Which openings could be measured
Only openings inside the 2021–2024 window have values on both sides, and only those with residential parcels nearby produce an estimate. Every computable estimate is reported, and the other 45 records are documented rather than dropped.

What the estimates show
They do not point in a consistent direction. Nine of the 18 estimates are negative and nine positive, and the median is +0.18 percentage points. The mean of +3.10 rests on a few large values: dropping the three estimates with extreme group means turns it into −0.38.
The sensitivity chart in the gallery applies five filters in turn, and the mean ranges from −0.38 to +8.63 depending on the filter, so no single number summarizes the result. Thirteen estimates cross a 2-percentage-point magnitude screen (six negative, seven positive); that is a size threshold, not a significance test.
Where my own method falls short
Before the latest release I reviewed my own analysis. These weaknesses limit what the estimates can support:
- The outcome is mass-appraised value, not sale prices. Reappraisal cycles and new construction can create one-year jumps unrelated to the market, and a few such jumps drive the largest estimates.
- There is no statistical inference. The 2-point screen is a magnitude rule, and some estimates rest on very few parcels.
- Parallel pre-opening trends are assumed, not tested; many openings have only one or two intervals before the opening.
- Comparison groups can be contaminated: one business’s comparison ring can contain another business’s nearby parcels.
- Neighboring parcels, and units appraised together in one complex, move together, so raw parcel counts overstate the independent information.
What the latest release fixed
- Earlier reports summarized business types using only the estimates that crossed the screen, which inflates category means, and described a negative contrast as lower appreciation. The release summarizes all 18 estimates and describes a contrast as a change in the gap.
- Subjective reliability labels became observable sample, timing, extreme-value, and address-match flags, and the retained results are validated before reporting.
- A separately tested estimation core requires positive values at both ends of each transition and matched calendar intervals between groups, removing two risks in the original calculation. It has not been applied to a new GIS analysis.
- The 35-page report, 9-page summary, and 21 charts come from shared content in PDF and Word, with 33 passing tests and a SHA-256 release manifest.
What it would take to answer the question
These steps need the original parcel data, and none of them has been run:
- A parcel-level panel regression, such as log value with parcel and year effects, to obtain standard errors and confidence intervals that account for spatial dependence.
- Values from before 2020, to test pre-opening trends with an event-study design; for one overall effect, an estimator built for staggered openings, such as Callaway and Sant’Anna.
- Placebo tests with false opening dates and random locations, and alternative distance rings.
- Verified ring geometry and opening dates, and estimates recomputed on matched annual data for both groups.
Technical details
Professional · Geospatial Software Developer / Data Scientist · Version 4, September 2026
Did residential appreciation near selected liquor, smoke, and adult-oriented business openings change relative to a surrounding comparison area? The outcome is annual appraised market value for 2020–2025, openings are spread across 2021–2024, and many openings have only a few nearby parcels.
- Define exposure by distance: residential parcels within 500 feet of an opening form the nearby group, and parcels 500 to 2,000 feet away form the comparison group.
- Use annual appreciation of appraised market values (2020–2025) as the outcome, averaged by group and year and split into periods before and after each opening.
- Estimate one difference-in-differences contrast per opening, the change in the nearby-minus-comparison appreciation gap, instead of one pooled estimate across openings from different years.
- Report all 18 computable estimates with their signs, and test how the average changes under five sample filters and magnitude screens of 1, 2, 5, and 10 percentage points.
- Review the method critically, correct interpretations and summaries it did not support, and fix two calculation risks in a separately tested estimation core.